About this episode
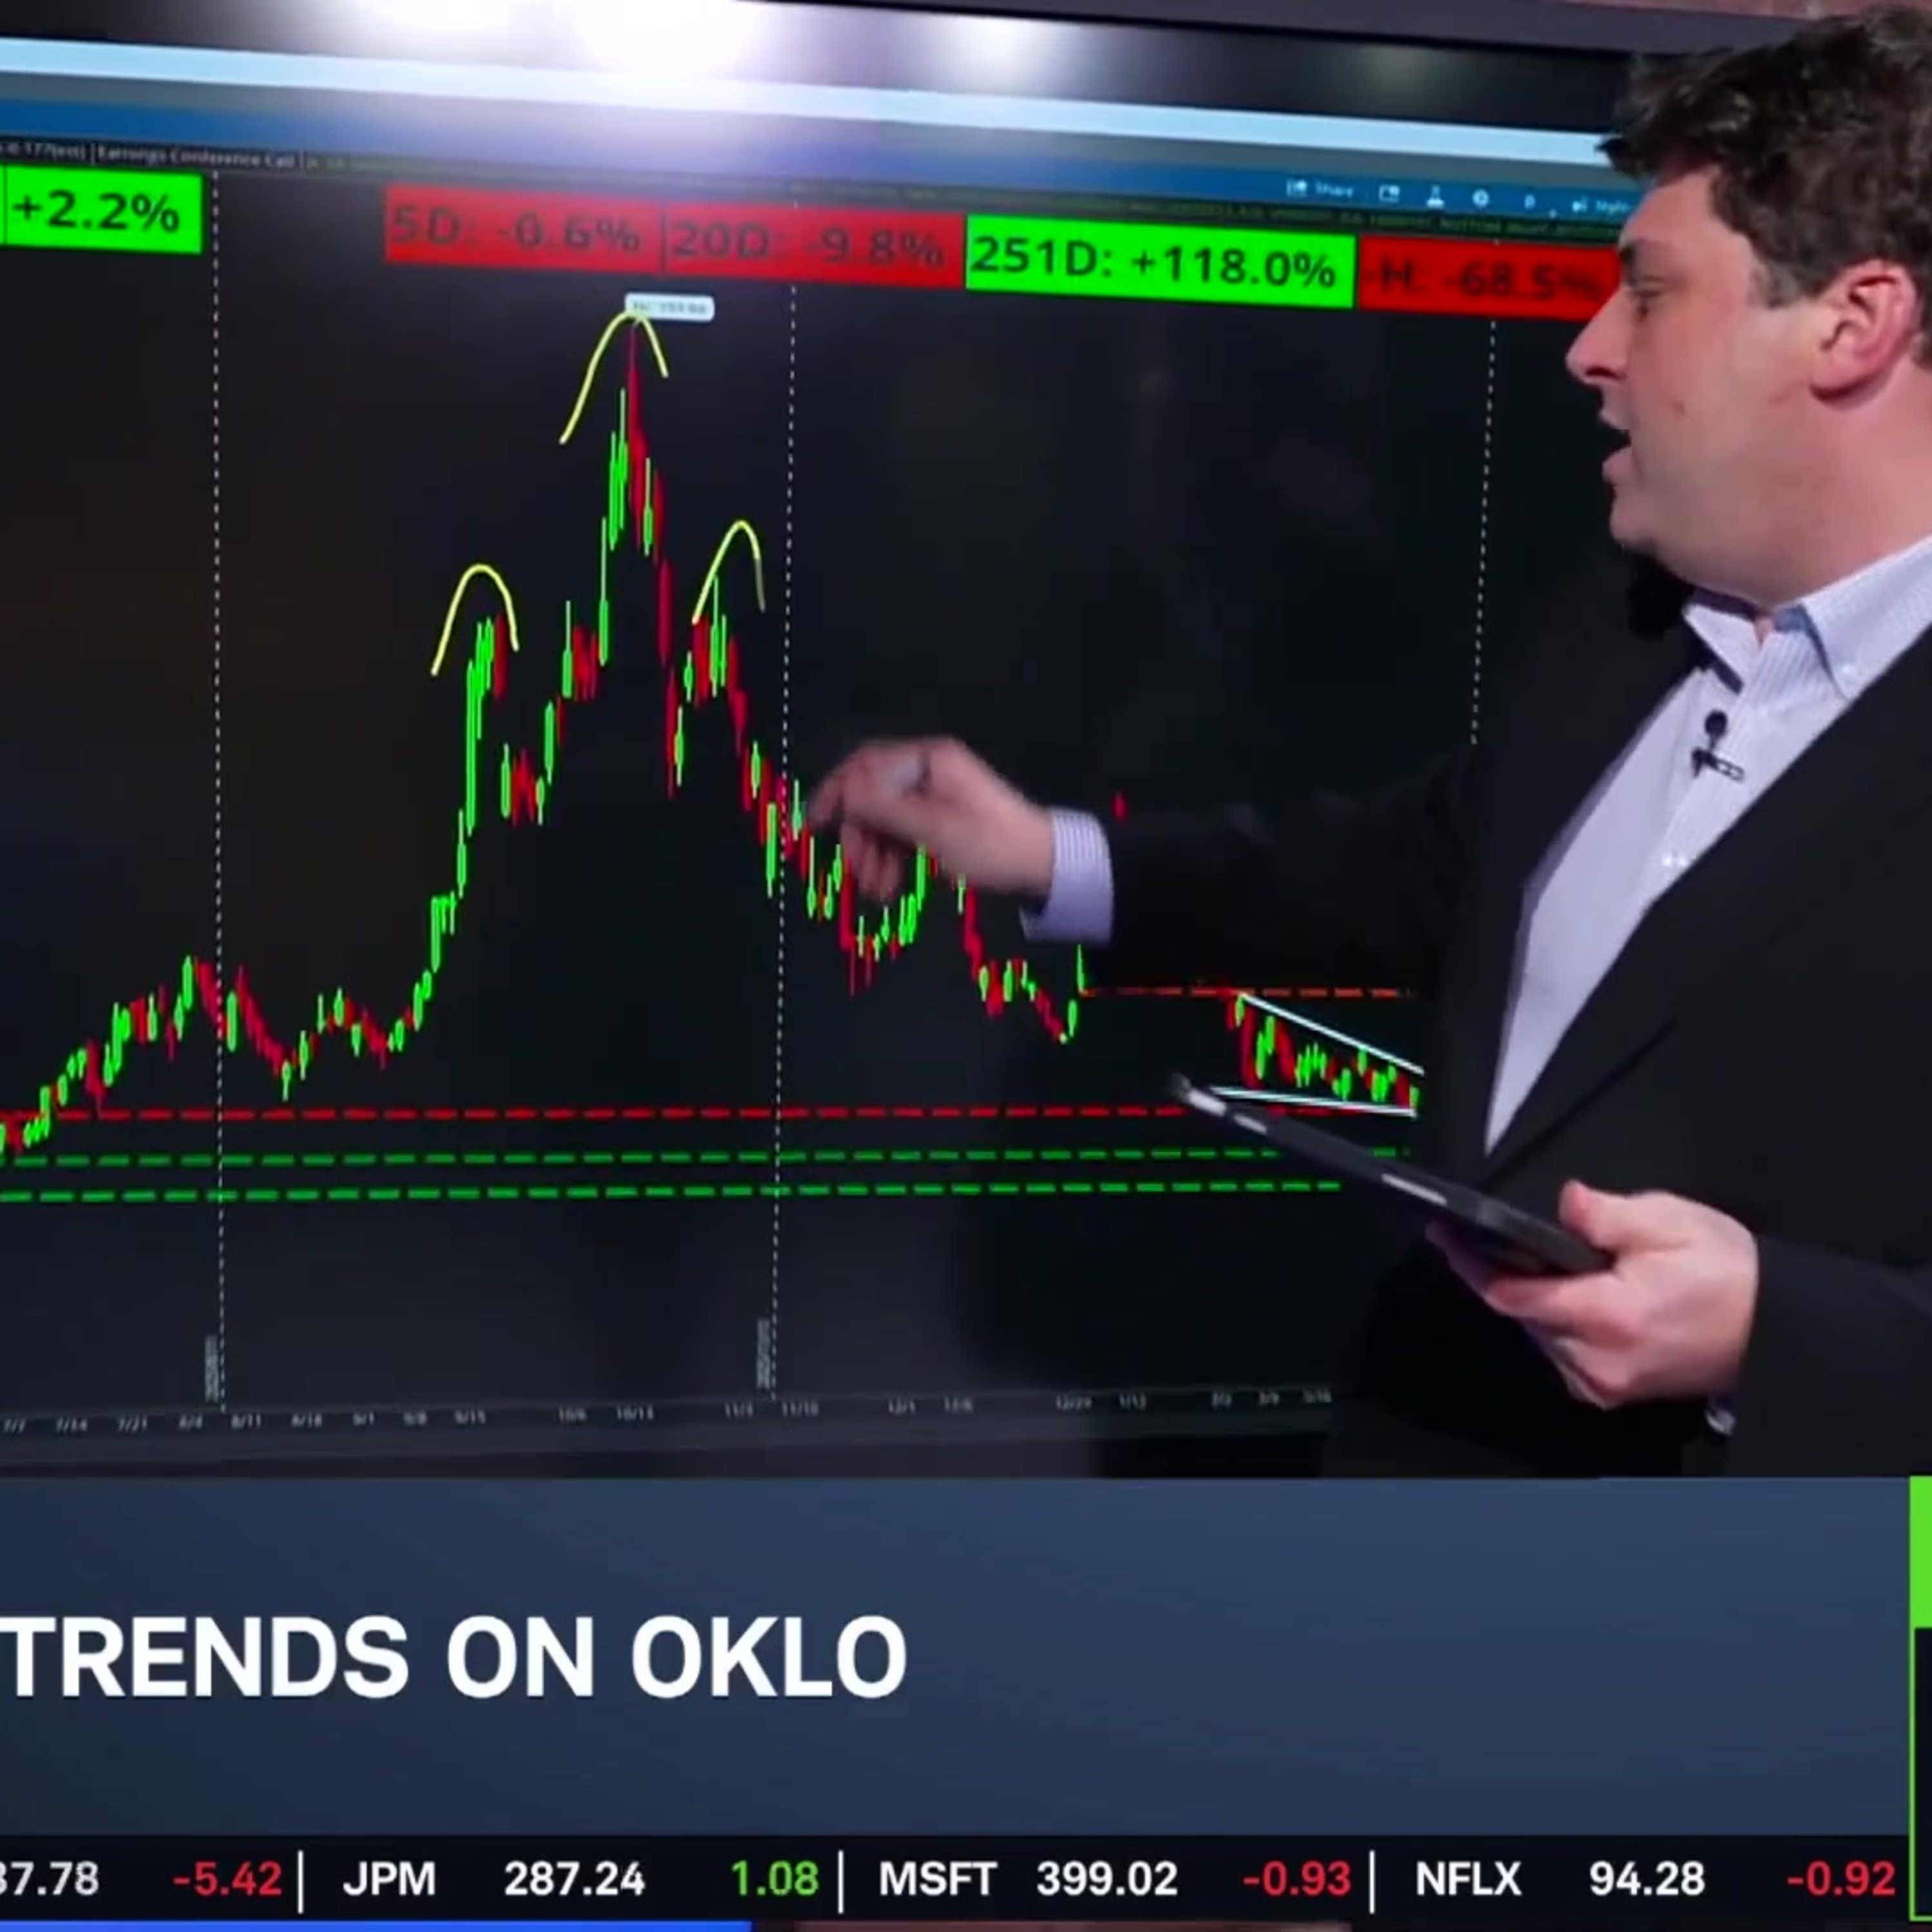
Oklo Inc. (OKLO) is a black sheep in the utilities sector due to its profound volatility — and more than 115% year-over-year rally. Rick Ducat compares the stock's moves to peers to show how significant its moves were. He turns to Oklo's chart to weigh where the next breakout can occur into earnings, then looks at options activity among traders.
======== Schwab Network ========
Empowering every investor and trader, every market day.
Options involve risks and are not suitable for all investors. Before trading, read the Options Disclosure Document. http://bit.ly/2v9tH6D
Subscribe to the Market Minute newsletter - https://schwabnetwork.com/subscribe
Download the iOS app - https://apps.apple.com/us/app/schwab-network/id1460719185
Download the Amazon Fire Tv App - https://www.amazon.com/TD-Ameritrade-Network/dp/B07KRD76C7
Watch on Sling - https://watch.sling.com/1/asset/191928615bd8d47686f94682aefaa007/watch
Watch on Vizio - https://www.vizio.com/en/watchfreeplus-explore
Watch on DistroTV - https://www.distro.tv/live/schwab-network/
Follow us on X – https://twitter.com/schwabnetwork
Follow us on Facebook – https://www.facebook.com/schwabnetwork
Follow us on LinkedIn - https://www.linkedin.com/company/schwab-network/
About Schwab Network - https://schwabnetwork.com/about
Get every episode summarized
Each time Schwab Network publishes, we email you a written briefing from the transcript — the topics, who appeared, and any specific claims, with the ad reads skipped.
Email me new episodesFree for 3 shows. No card needed.
Transcript ready
79 searchable segments. Every word is indexed and playable.
Full transcript
Schwab Network — OKLO Rallies into Earnings, Stands Out Among Utilities. Machine-transcribed; use the interactive transcript above to jump the player to any line.
Welcome back to Market On Quarters, I'm Sam Vargas on the floor of the New York Stock Exchange. It's time now for options corner. So, Rick, your cat is standing by Lee Market Technician and today, Rick, we are looking at Aqua ahead of these earnings this afternoon, a pretty volatile high beta stock. Just talk us through how the chart is stacking up against some of its peers in this space. Sure. Yeah. This company is part of the utility sector, not really known for its high flying volatility. We typically are more stable companies here, but as you can see, up 118% this year, which is actually significantly down from the highs that we saw earlier, over 500% at one point. But we can see as well, yes and P, during that time frame, only up about 18%. These are some of the companies that are in this kind of nuclear energy space as well. What makes Oklahoma a little different is that for one thing, they're commercializing nuclear fuel recycling and they're trying to convert nuclear waste into usable reactor fuel. But the other thing is that, obviously, a major investment is open AI, CEO, Sam Altman.
So, open AI is very aggressively pursuing this kind of vertical integration strategy where they would own the means of producing the massive amounts of power that their AI uses here. So, to take that one step further, keep in mind that this vertical integration idea means that they also want to reduce their reliance on chips like the likes of NVIDIA and kind of develop their own systems. They have this very large agreement with Broadcom recently, so just some food for thought about this space. Yeah, it's interesting, isn't it? It's got this sort of partnership with Meta as well, but I mean, that chart really says it all that you're standing next to, Rick, I mean, this stock has had an enormous amount of capital pumped into it on the thinking here that this is going to be this reliable, nice load power that's going to promise to really power everything with respect to artificial intelligence. So, just walk us through the technical specifically for Auckland. Right. So, here was kind of this big run-up that we were pointing out earlier here. You can see it did sort of materialize into a head and shoulders-type pattern here with
our neckline coming in around 115 or so. From there, we have moderated somewhat that level near 120, 115 did come back into focus once more. That was a high point after our recent attempt to rally once more. From there, though, we've declined once again. Now our shape is a falling wedge-type shape here. Our two downward sloping trend lines are converging toward each other here. It's a rather narrow and kind of tight range here, but it also coincided with a supportive area. If you were to backtrack a little bit here, the 58 level represents some old highs, a low point there. These green lines here also represent some low points after our gap. So, between about 44 to 58 was this supportive zone here, 58 is around where we bottomed out recently. So, falling wedge-type shape, typically, regardless, more bullish actually here. So, it should be an interesting development here to see what happens after we do get our earnings event. So, our two longer-term moving averages that we follow are gold 63-day quarterly, our
orange 251-day yearly exponential moving averages. Both come together around 73 to 75 roughly, so that provides us with a convenient potential tipping point to keep an eye on in terms of resistance for a breakout possibility here. So, when we also look at our volume profile study, we can see that the notable trading areas, one is down here, but that's kind of the first phase of this chart, this area from 22 to 30, has been left in the dust more or less here. Now, 50 to about 80, once again a rather broad range, that's kind of the general trading area here, is punctuated by our point of control, this thick red line at 66, that's the heaviest trading area of all. So, if we start to work our way above 80, the other kind of standout levels come in near 90, and then around 110, 115 or so. So, those could be some other levels to watch from this volume perspective here. All right, and what about options activity? What are you seeing on that front?
Sure, so expected move, kind of looking forward to the next few explorations here, March 20th monthly expiration as our orange smaller box here, giving us a plus or minus range of about 10.8%. Again, pretty notable for a utility type company here. Today's sizzle, 3.1 times the five day moving average of options volume here, that equates to about 80,000 contracts changing hands last time I checked, about 67% were calls today as well. One notable trade, minus 500, January 15th 60 strike puts, it was about an 868,000 dollar credit received, unclear though if this was an opening or closing trade here. All right, great stuff, Rick, thank you so much for the preview ahead of this earnings report. Later this afternoon after the bell, we will get you across that as and when.
More episodes
More from Schwab Network

Stock Market Today: ORCL & ADBE Earnings, AEO Plunges Near 52-Week Low
Schwab Network

Thursday's Final Takeaways: Crude Taps $103 & PPI Hotter than Expected
Schwab Network

Balancing High-Conviction AI With High-Dividend Diversification
Schwab Network

EARNINGS PANEL: ORCL, ADBE
Schwab Network