About this episode
After crude oil's parabolic rally this week, Neal Dingmann turns to the energy sector and explains how the massive move is small when you compare it to the one-year chart. He highlights stocks to watch and ways to position your portfolio as Iran volatility rattles markets. Tom White offers an example options trade for the United States Oil Fund ETF (USO).
======== Schwab Network ========
Empowering every investor and trader, every market day.
Options involve risks and are not suitable for all investors. Before trading, read the Options Disclosure Document. http://bit.ly/2v9tH6D
Subscribe to the Market Minute newsletter - https://schwabnetwork.com/subscribe
Download the iOS app - https://apps.apple.com/us/app/schwab-network/id1460719185
Download the Amazon Fire Tv App - https://www.amazon.com/TD-Ameritrade-Network/dp/B07KRD76C7
Watch on Sling - https://watch.sling.com/1/asset/191928615bd8d47686f94682aefaa007/watch
Watch on Vizio - https://www.vizio.com/en/watchfreeplus-explore
Watch on DistroTV - https://www.distro.tv/live/schwab-network/
Follow us on X – https://twitter.com/schwabnetwork
Follow us on Facebook – https://www.facebook.com/schwabnetwork
Follow us on LinkedIn - https://www.linkedin.com/company/schwab-network/
About Schwab Network - https://schwabnetwork.com/about
Get every episode summarized
Each time Schwab Network publishes, we email you a written briefing from the transcript — the topics, who appeared, and any specific claims, with the ad reads skipped.
Email me new episodesFree for 3 shows. No card needed.
Transcript ready
119 searchable segments. Every word is indexed and playable.
Full transcript
Schwab Network — Navigating Energy Sector Surge & Options Amid Iran Volatility. Machine-transcribed; use the interactive transcript above to jump the player to any line.
We're back on Morning Trade Live. There are plenty of things moving stock's lower today as subparton on farm payrolls print, retail sales that move lower month over month, but a lot of today's trade is centered on what's happening in crude oil. We cleared the $89 level for the first time in two years today and here is where we're currently trading right now. We are around that level. Look at that verticals line. You can see there off the back of obviously what we've got this week. So let's talk about this. Go inside out on the energy sector and how crude prices are impacting some of these stocks. Joining us now is Neil Dingman, who's the research analyst for Energy over at William Blair at Neil. Thanks so much for your time. Look, I mean, the art performance for some of these energy stocks, I mean, has been very obvious. The XLE, it's stronger start, I believe, since the 90s. Just give us a sense of how different this is to previous energy shocks we've seen. I mean, if we take a look at sort of most recently, 2022, but also throughout the course of history. Yes, nice to see this morning.
It's not terribly different. What we're noticing on these stocks, like if you look at most of mine, most of these stocks are tracking more what the 12-month strip is doing, which again, your chart showed exactly what the spot I look today and you have the spot market, as you said at $89 yet if you go out 12 months and you look at it, you're at $67 or so, almost $22 lower for a 12-month strip. And so as a result, if I look at some of my EMPs, they're only up much like the strip, the 12-month strip, they're up about 4 to 5% in the last five days. Whereas if you look at an ETF like the USO that tracks more what the spot market is doing, I just noticed the USO is now up 28% in the last five days. So again, what's going to be very, I think, telling is if a lot of the, until you mentioned earlier, the straighter booth stays down if some of the other big facilities start to go down and we see the backward end of the strip start to move up, then I think we even
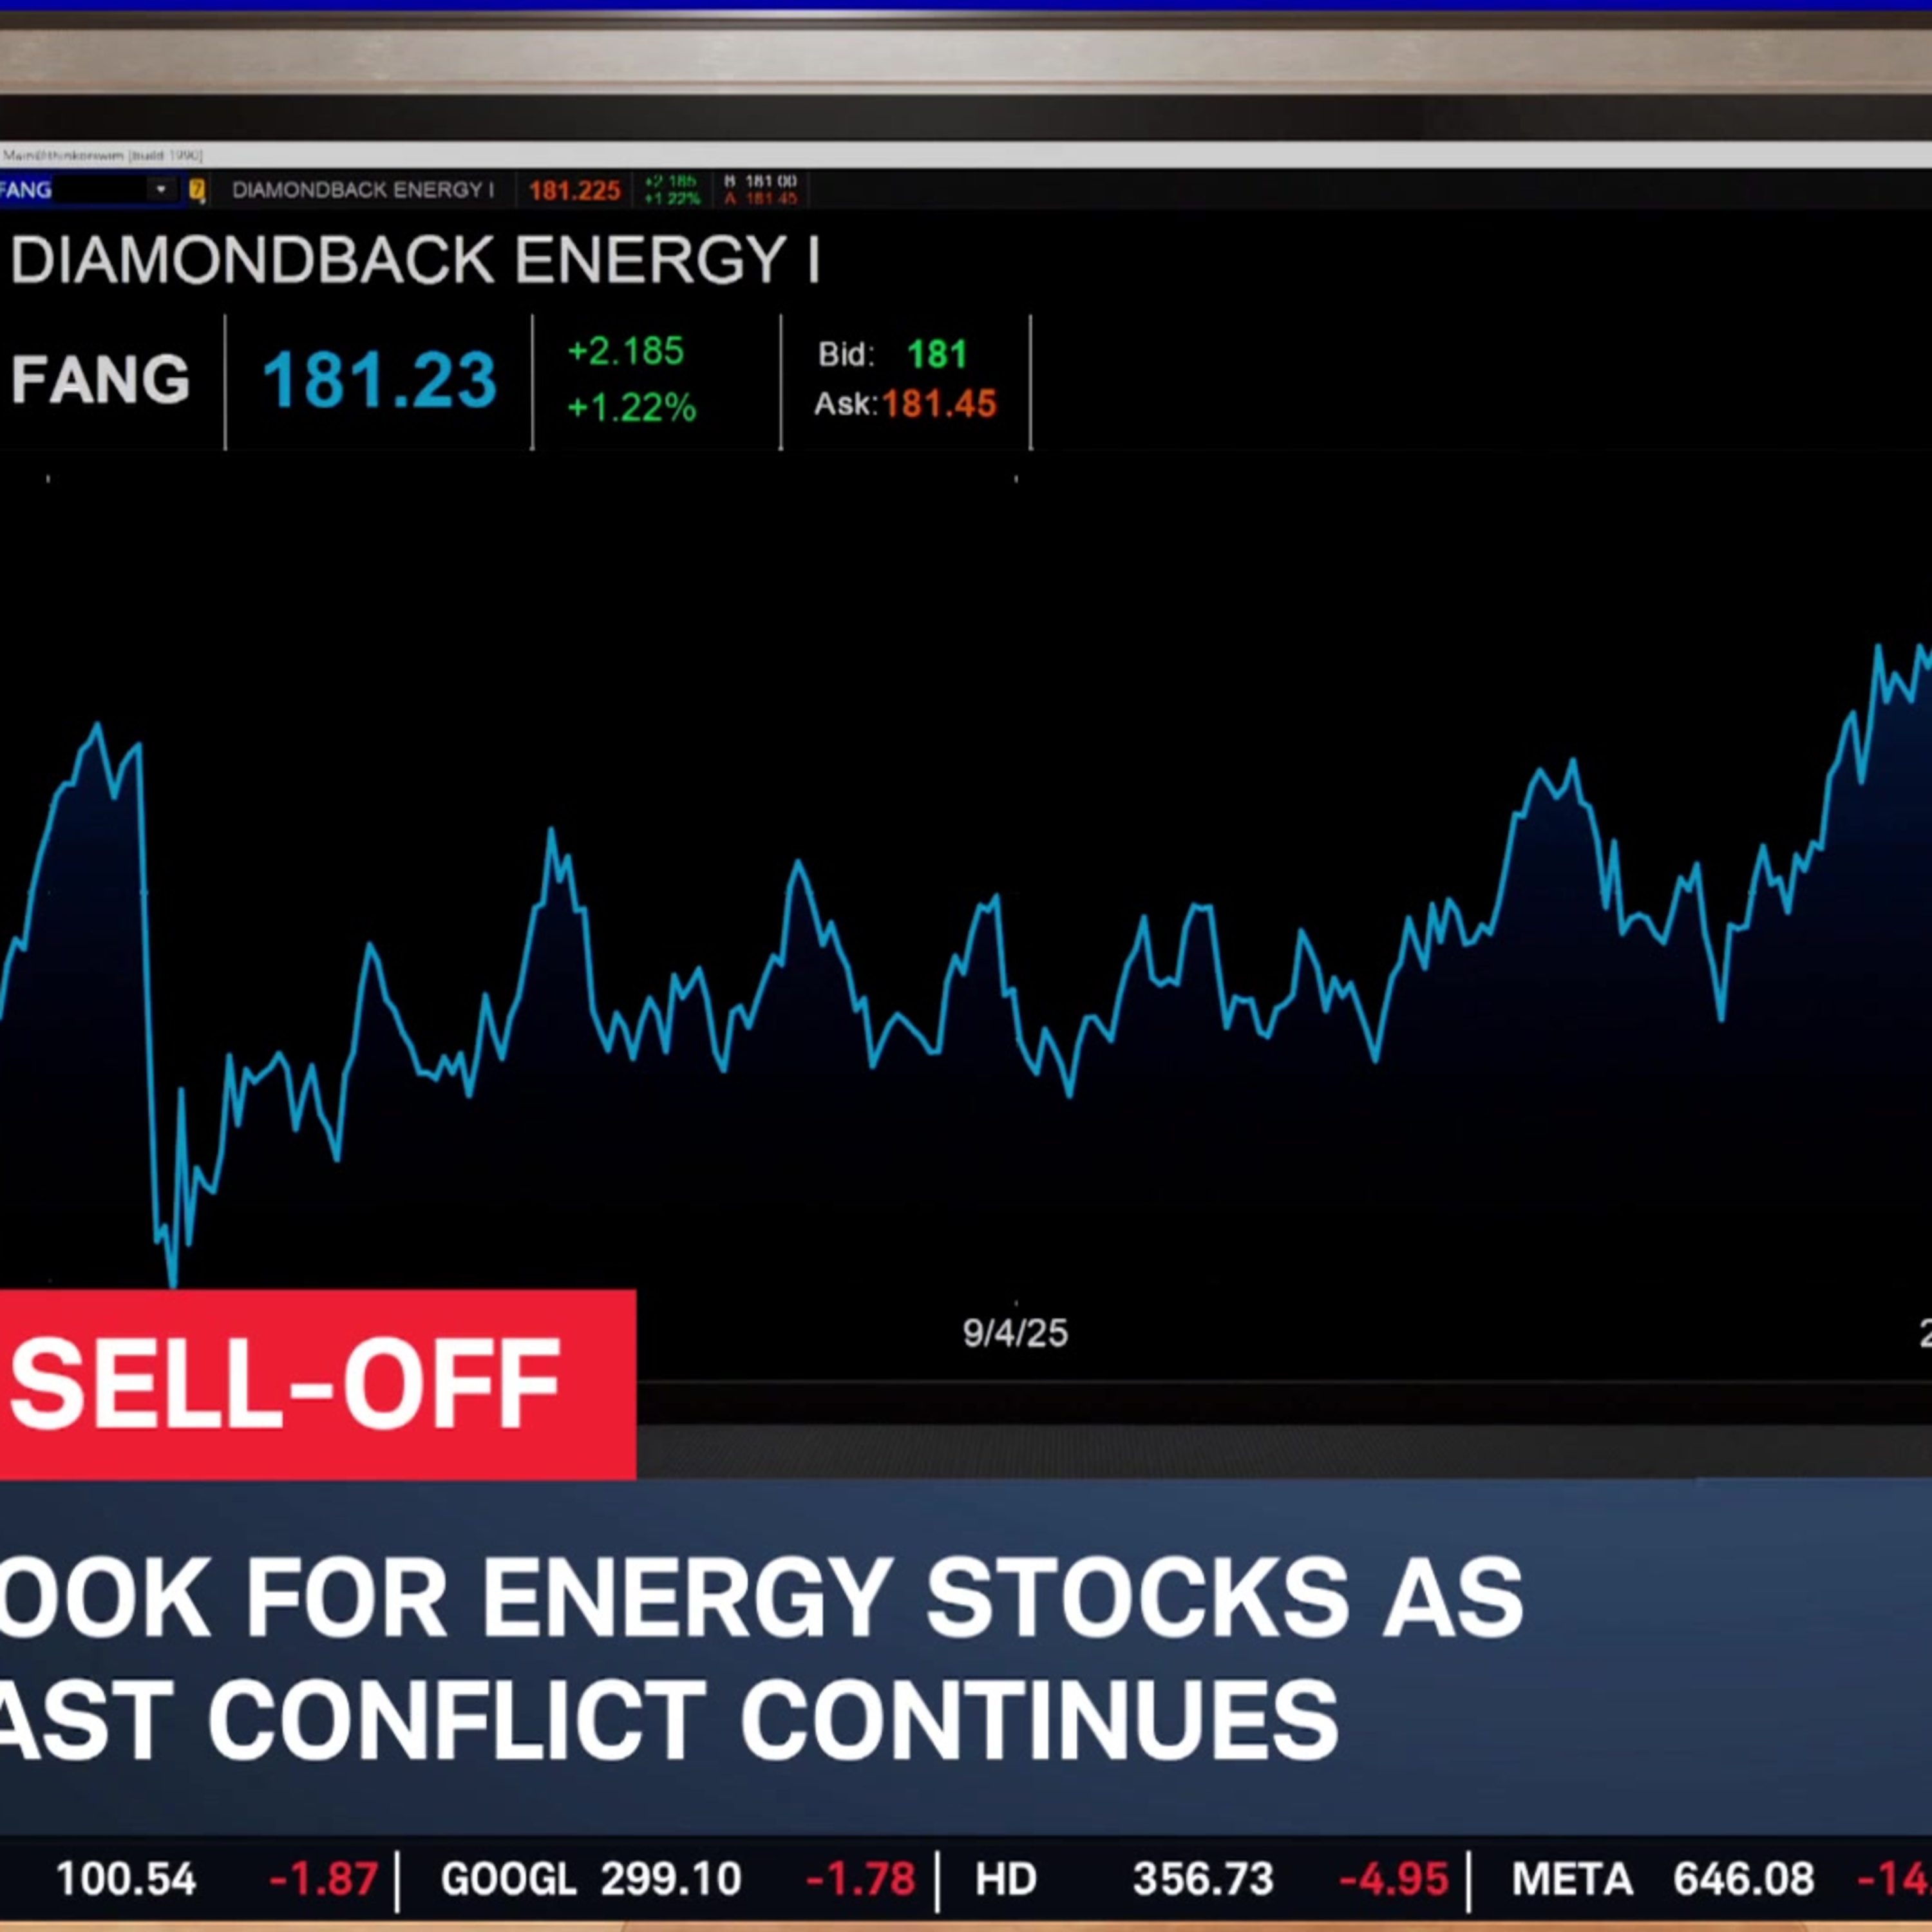
get a much more pronounced upward movement of most of these oil and gas stocks. But even before what we got this week with Epic Fury, I mean, we were talking about a commodity bull market largely on, of course, some of the AI demand and basically the growth picture. I mean, you know, the economy has been holding up pretty well. So we've been the biggest opportunities in this energy sector. I think your point has been well taken because even prior to this, most of the group was already up 20, 25% year to date prior to this week. So again, as I mentioned, I look at two of our favorites, a Devon or Diamondback. They're up about 5% this week, but they're both up about 25% for the year. So again, we think the best upside is going to be number one on the oil side, I think, especially for some of these big Permian players, we mentioned Diamondback and Devon. We think two of the best lowest cost operators, obviously Devon, the setup is going to be interesting because they're merger with Cateria, which is going to go final in the next
couple quarters or in the next quarter, I should say. And then Diamondback, the lowest cost operator, they also have the subsidiary of their mineral companies. So again, I think they're very, very well positioned. And then again, I think a gas name like an EQT has a fantastic setup, again, connected to the AI power demand, but given what's going on now, we're still focusing more on these oily stocks. Okay, what sort of risks or counter trends, though, are you keeping an eye on for energy? It's definitely going to be prices. I mean, again, if the demand, again, we don't worry about supply terribly much because we do think that the amount of domestic supply is rather limited. So it is going to be a demand picture and if demand starts, because prior to the conflict, it was suggested that maybe demand would only be up one or two percent here in the States. You know, that's what we're going to be looking at much more closely because again, there's a fine line and a big difference between, you know, let's call it $70 oil and $60 oil.
And as I mentioned, a big, big difference right now is I can't say enough, the spot market you pointed out is at $89, you have that on your screen, but the 12 months is at 67. So we'll continue to be watching that 12 month very, very closely. All right. We're going to wrap it up there, Neil, but thanks so much for the insight today. Really appreciate it. Have a great weekend. No doubt you will be very, very busy. Neil Dingman there, who's the research analyst for Energy at William Blair, appreciate it. Let's trade the USO ETF now, which is sitting at a 52 week high today, Tom White. Just to give us an example trade for this one this morning, given, of course, these gains we're seeing right now. Yeah. This is sometimes used by traders as a proxy for, you know, trading the oil markets without trading maybe oil futures or an individual name here, USO up nearly 30% so far just this week. It's been a parabolic move to the upside, the RSI or relative strength index over 85 levels. So anything above 70s considered overbought in a technical basis, but as a lot of people
have stated, we could see oil moving higher here. And if you take a look at what we, when you look at something like this in the USO, you can use the option market to create a little bit more leverage, stay risk-defying in an option strategy as opposed to just trading the ETF outright. So I looked at a strategy, it takes advantage of a pullback, but I've given myself duration on this one. We're going to see uncertainty probably here in the near term. So I kind of wanted to push that aside. I went out to the April monthly options, 42 days to expiration here. And I looked at buying a bearish put diagonal here to the downside. So I'll buy the April 105 strike puts. And then against that, in the near term, March 20th monthly options that expire in just about two weeks here will sell the 90 strike puts. So a bearish $15 wide put diagonal, you're going to pay roughly about $10.5 for this bearish $15 wide spread. So you're paying less than the width of it.
And so that's going to be your risk, because that was just over $1,000 per spread on this one. From the risk profile, it apex, apex is out back at about the 90 level, right? That's about $15 below where USO is currently trading. So you need some downside movement. Anything below about 102 is going to be potential profitability on this one. And you're paying less than the width of the put diagonal, because you're buying about an 89% implied volatility on aggregate in that April option series where you're buying the 105 put, selling about 116% implied volatility in the near term, March 20th weekly. Where you're selling that 90 put now, you'll get about four opportunities to roll or adjust that short option. Those can expand to over $5, $6 each, and you get four opportunities to do that. So that'll increase potential profitability and lower your risk each time you adjust that short option as you get closer to expiration. But this is definitely a bearish look on this trade. Okay, a good look at the energy market across the landscape for us this morning with that
ETF. An example trade really appreciate it, Tom White. And we have of course got to stocks at lower for us this morning as oil spikes and the jobs number comes in with a surprise downside.
More episodes
More from Schwab Network

Stock Market Today: ORCL & ADBE Earnings, AEO Plunges Near 52-Week Low
Schwab Network

Thursday's Final Takeaways: Crude Taps $103 & PPI Hotter than Expected
Schwab Network

Balancing High-Conviction AI With High-Dividend Diversification
Schwab Network

EARNINGS PANEL: ORCL, ADBE
Schwab Network