About this episode
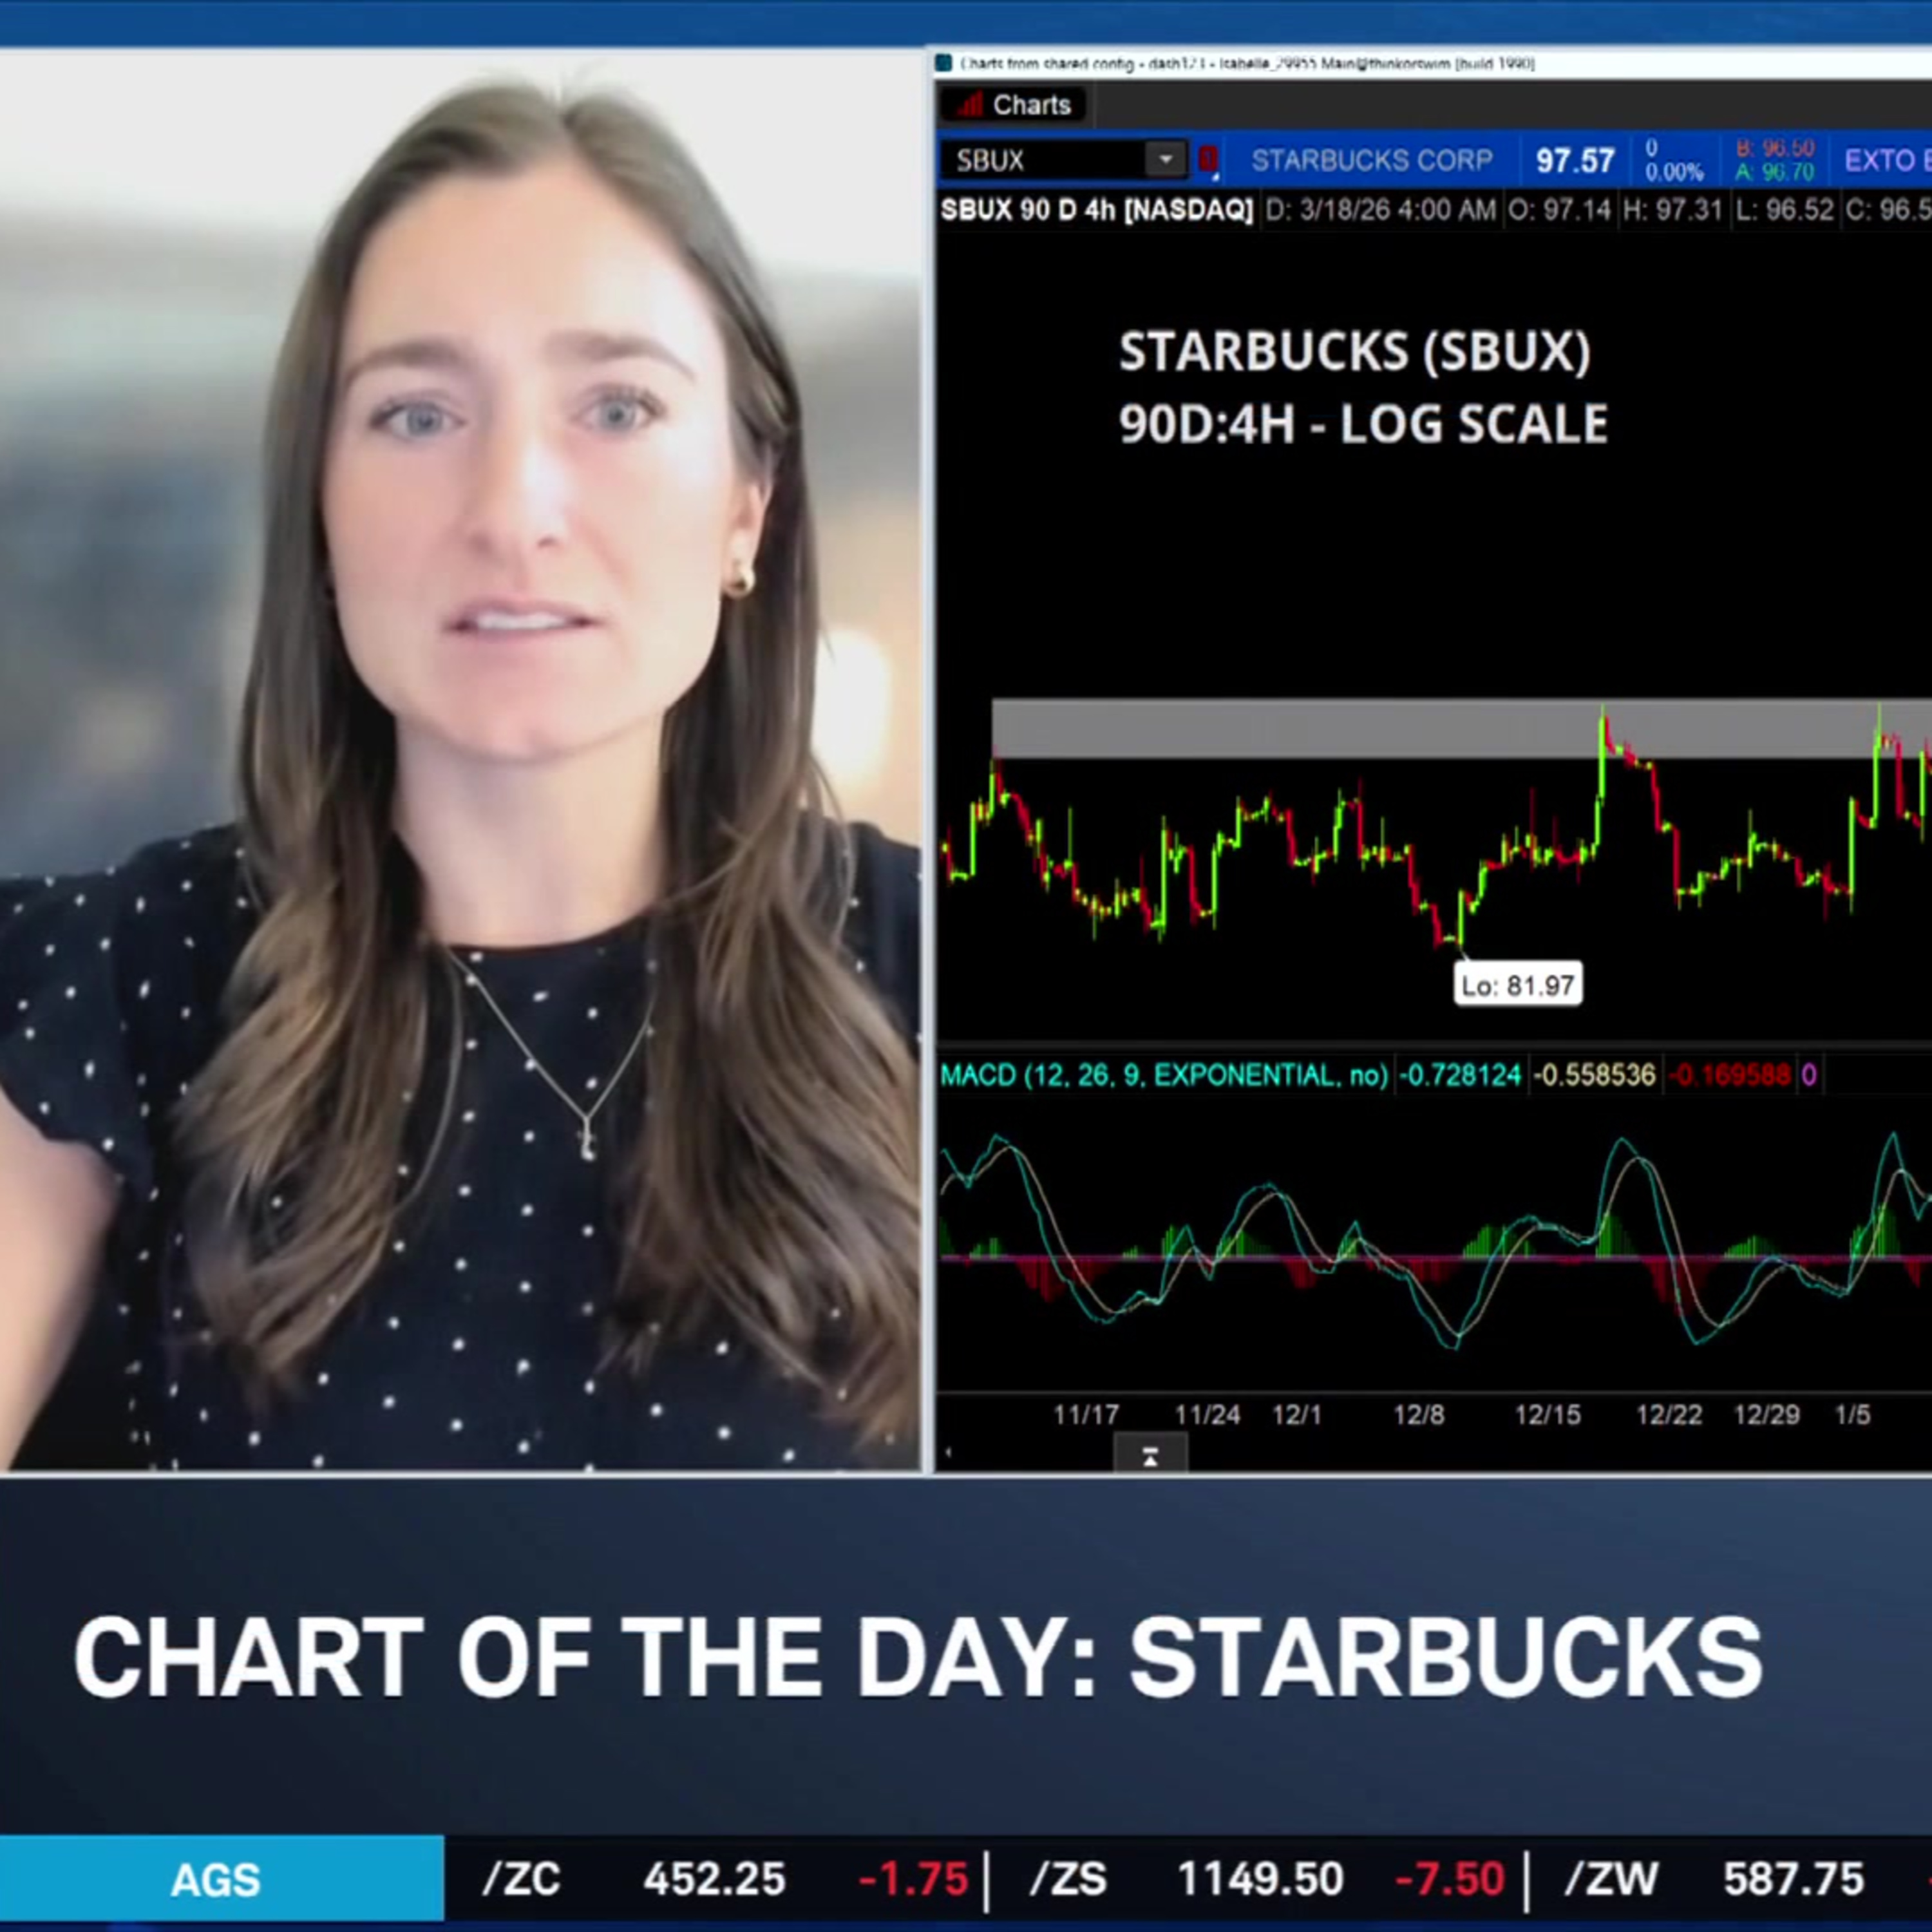
Starbucks (SBUX) shares recently got a jolt of caffeine after jumping to 52-week highs. Rachel Dashiell with Charles Schwab turns to the short and long-term price action of the coffee giant as it shapes up a rebound story.
======== Schwab Network ========
Empowering every investor and trader, every market day.
Subscribe to the Market Minute newsletter - https://schwabnetwork.com/subscribe
Download the iOS app - https://apps.apple.com/us/app/schwab-network/id1460719185
Download the Amazon Fire Tv App - https://www.amazon.com/TD-Ameritrade-Network/dp/B07KRD76C7
Watch on Sling - https://watch.sling.com/1/asset/191928615bd8d47686f94682aefaa007/watch
Watch on Vizio - https://www.vizio.com/en/watchfreeplus-explore
Watch on DistroTV - https://www.distro.tv/live/schwab-network/
Follow us on X – / schwabnetwork
Follow us on Facebook – / schwabnetwork
Follow us on LinkedIn - / schwab-network
About Schwab Network - https://schwabnetwork.com/about
Get every episode summarized
Each time Schwab Network publishes, we email you a written briefing from the transcript — the topics, who appeared, and any specific claims, with the ad reads skipped.
Email me new episodesFree for 3 shows. No card needed.
Transcript ready
33 searchable segments. Every word is indexed and playable.
Full transcript
Schwab Network — Chart of the Day: SBUX Rebound Story. Machine-transcribed; use the interactive transcript above to jump the player to any line.
I'm now for our chart of the day joining us for a breakdown. It's Rachel DeShel, Senior Manager, Trading Services, Charles Schwab. All right, Rachel, let's get into this chart so far this year. It's actually had a jolt of energy, but you've got a short-term look at Starbucks. Take us through what you notice. Yes, Diane, great to join you and I could use that little jolt of energy this morning with a nice little Starbucks, too. But just looking at the chart, you can see the first half of this four-month period on the shorter-term has really been characterized by that range-bound price action before breaking above resistance around $90 or so. Then we saw that price moved in New Yearly highs and has really been creating this major coil sense. And it's really deciding which way it's going. Price is really going to get pushed to next. And this is all happening while momentum has been rather weak in the short-term with the MACD line below the zero line here. And however, with momentum with the MACD, it does look like momentum's waning a little bit to
the downside. And we have price currently sitting on Trendline Support, which will really act as that first-level traders will be monitoring here. I would say the most valid short-term support really exists at that older resistance where we saw the breakout earlier right around $90 or so. But if traders do see a bounce here at Trendline Support, they will be looking to the top of that possible triangle pattern there and purple right around that 101-102S resistance. Okay, all right. So let's get into a longer-term look at Starbucks. What does that look like? Yeah, I like the longer-term chart a little bit better because you can zoom out and get the full context of those formations that we just saw on the shorter-term chart. And you can really see that this large coil is occurring right at a level of resistance at that really large zone around $100. That's been touched quite a few times this year. And I think what's interesting is that this large
really this large possible triangle formation is also acting as a handle in this larger bullish cup and handle formation that really started last July. And you could really see that rounded bottom of the cup and handle really takes shape throughout most of the year, really leading up into this price squeeze. So a couple of things about what we're seeing right now. You can when we see price coiling like this, we can also see that volatility is getting compressed, which is what we can see below with that Bollinger bandwidth really squeezing into some of the tightest levels that we've seen all year. We know volatility is mean reverting, so periods of low vol switch to high-vol and volatility often companies big breakouts. So we need to remember that those breakouts happen in either direction. So I'd say if we get a bounce heater from the lower bounds of this pattern, traders may expect to see levels above 100 and possibly quite a bit higher as low, which still aligns with their price targets. All right, thank you Rachel. That's Rachel Deschelles,
Senior Manager Trading Services Charles Schwab.
More episodes
More from Schwab Network

Stock Market Today: ORCL & ADBE Earnings, AEO Plunges Near 52-Week Low
Schwab Network

Thursday's Final Takeaways: Crude Taps $103 & PPI Hotter than Expected
Schwab Network

Balancing High-Conviction AI With High-Dividend Diversification
Schwab Network

EARNINGS PANEL: ORCL, ADBE
Schwab Network