About this episode
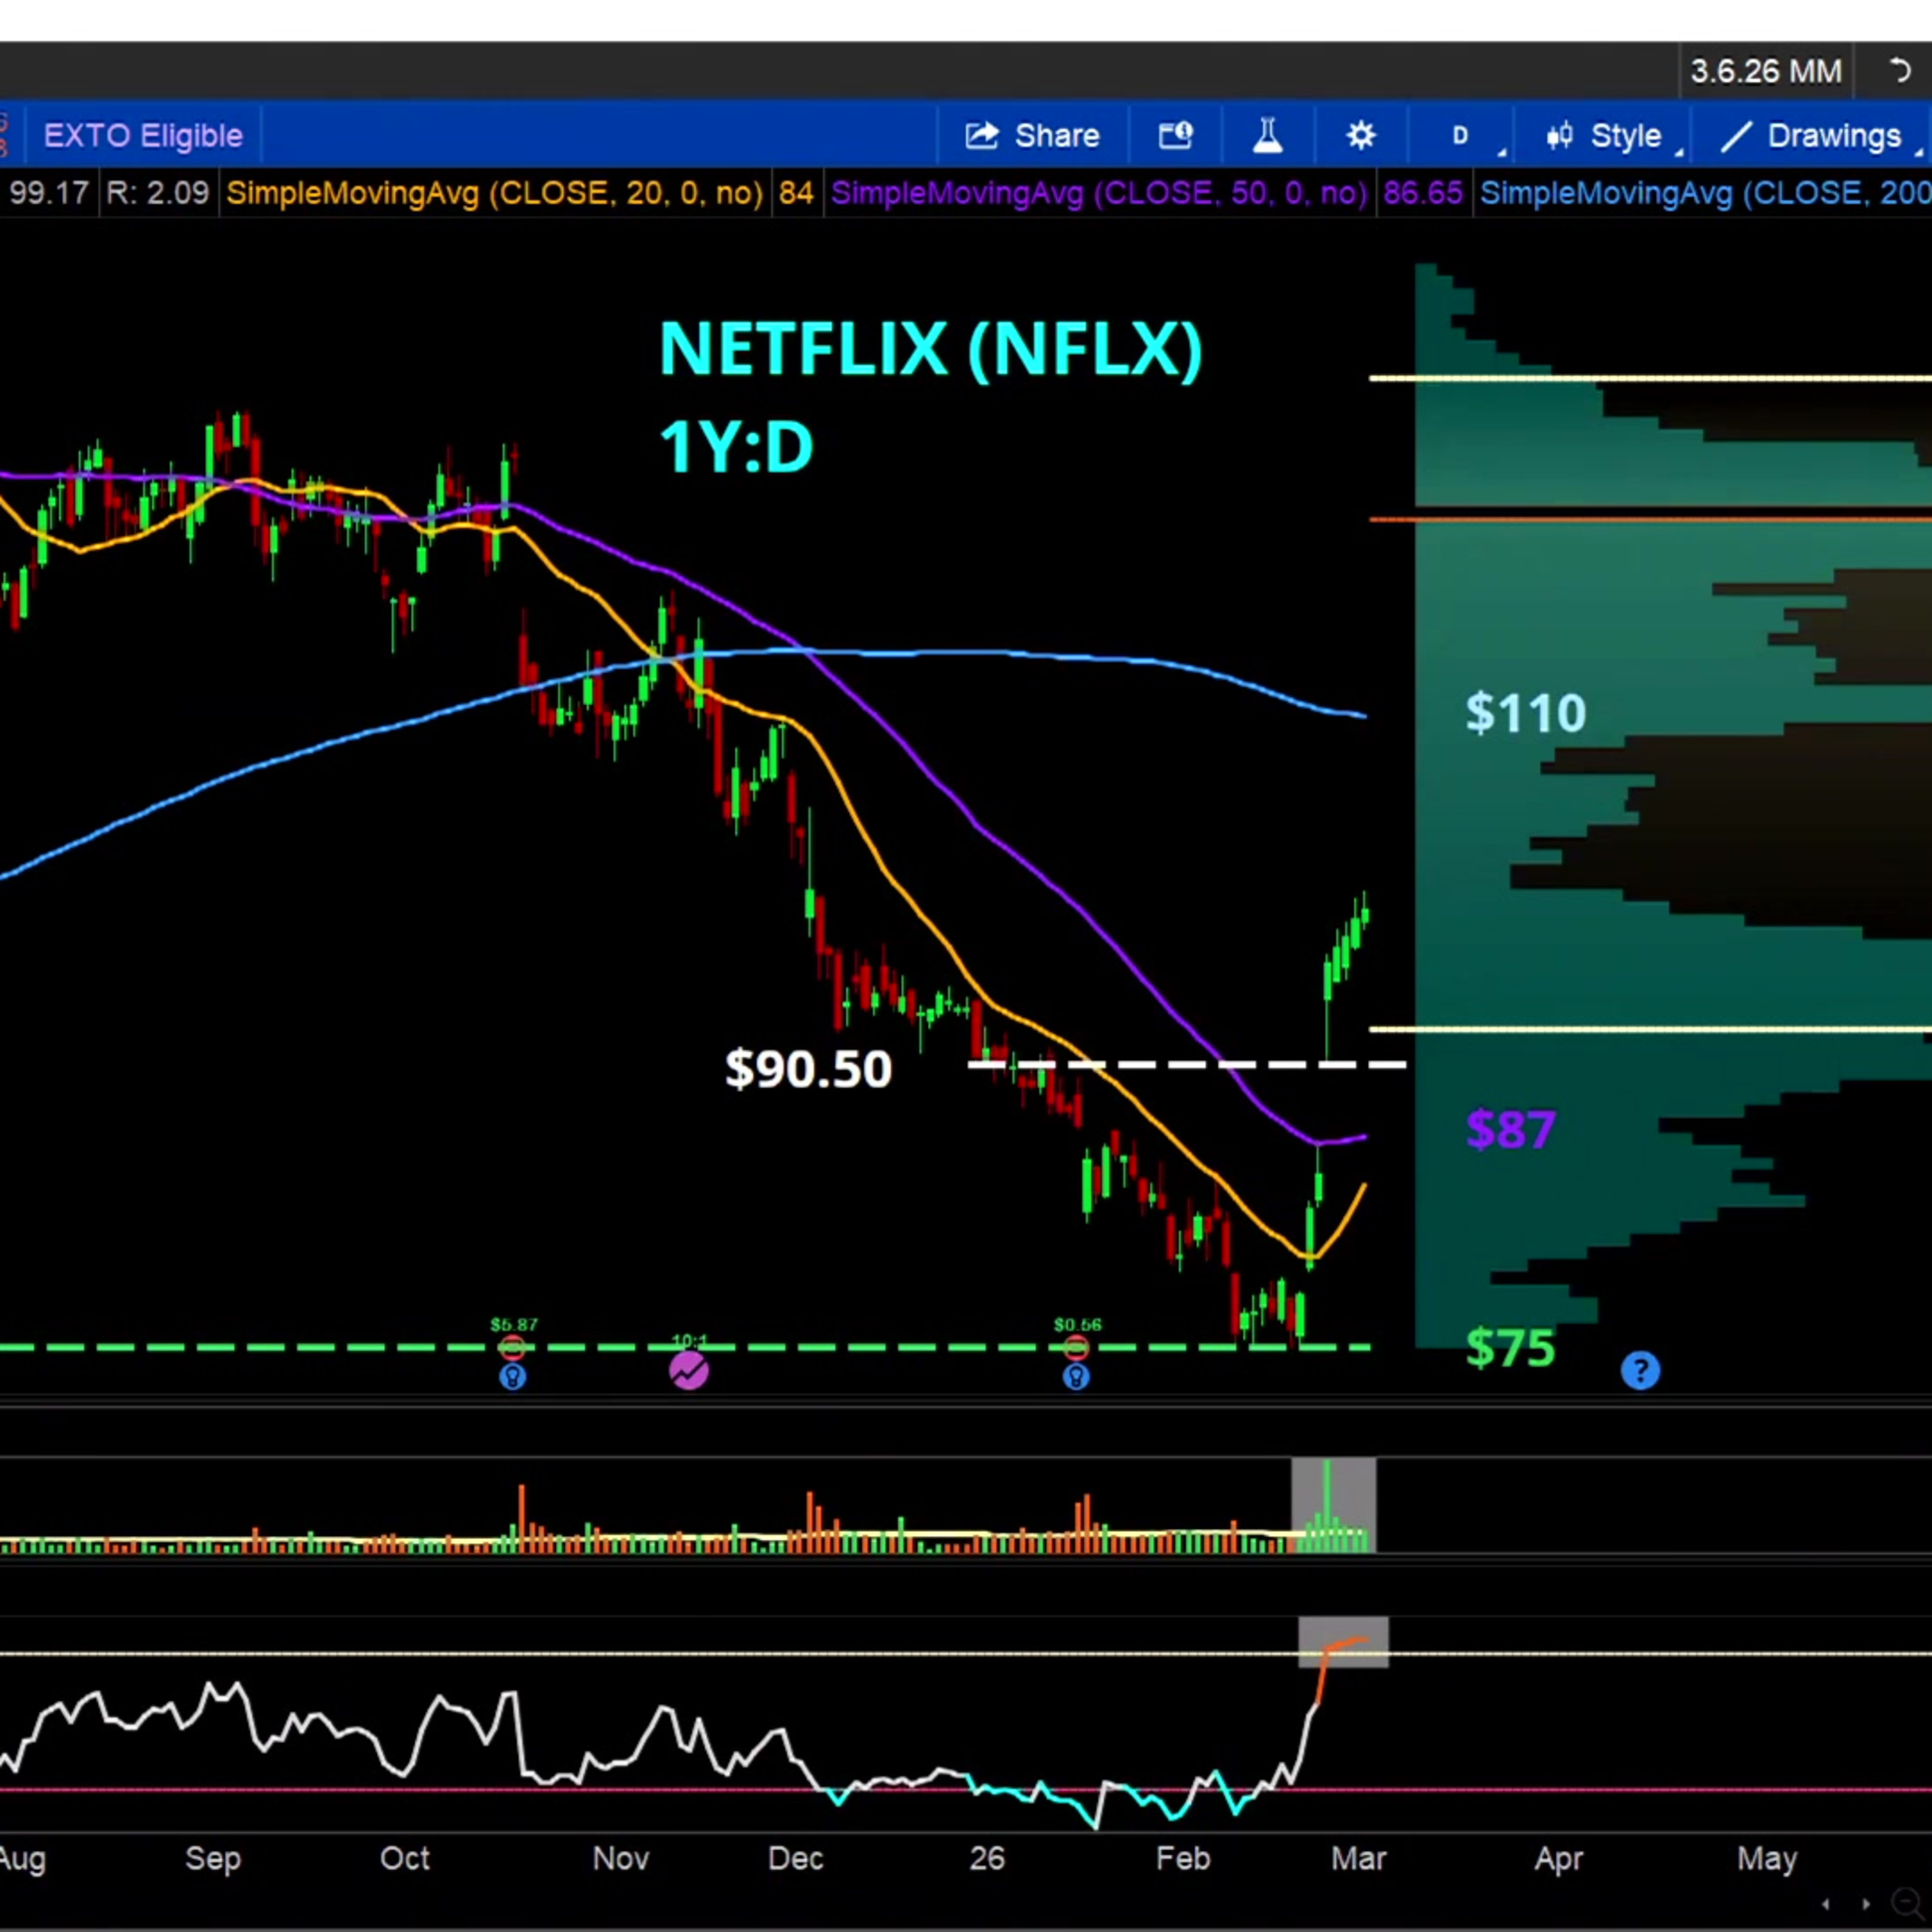
Netflix (NFLX) shares fell 40% from record highs at the end of February and have since rebounded after losing the bidding war for Warner Bros. Discovery (WBD) to Paramount Skydance (PSKY). Charles Schwab's Kevin Horner highlights key levels to watch for the streaming giant in the short and long-term.
======== Schwab Network ========
Empowering every investor and trader, every market day.
Subscribe to the Market Minute newsletter - https://schwabnetwork.com/subscribe
Download the iOS app - https://apps.apple.com/us/app/schwab-network/id1460719185
Download the Amazon Fire Tv App - https://www.amazon.com/TD-Ameritrade-Network/dp/B07KRD76C7
Watch on Sling - https://watch.sling.com/1/asset/191928615bd8d47686f94682aefaa007/watch
Watch on Vizio - https://www.vizio.com/en/watchfreeplus-explore
Watch on DistroTV - https://www.distro.tv/live/schwab-network/
Follow us on X – / schwabnetwork
Follow us on Facebook – / schwabnetwork
Follow us on LinkedIn - / schwab-network
About Schwab Network - https://schwabnetwork.com/about
Get every episode summarized
Each time Schwab Network publishes, we email you a written briefing from the transcript — the topics, who appeared, and any specific claims, with the ad reads skipped.
Email me new episodesFree for 3 shows. No card needed.
Transcript ready
32 searchable segments. Every word is indexed and playable.
Full transcript
Schwab Network — Chart of the Day: NFLX Key Levels. Machine-transcribed; use the interactive transcript above to jump the player to any line.
So I'm now for our chart of the day joining us for a breakdown of Kevin Horner senior manager trading services Charles Schwab Kevin I know the day doesn't look like and look we might have broad market weakness again today But I know some investors breathe a sigh of relief when it came to Netflix and that Warner Brothers deal But take us through your first chart and what that looks like for Netflix sure thing day and good morning You know, I was watching this one along with a many many traders You know the level to which a Netflix and following was pretty intriguing It actually pulled back 50% of its full rally from the bottom in 2022 to its recent peak So 75 was a very important level to hold and we spiked dramatically after the Completion of the Warner Brothers Discovery deal where Netflix bows out So the thing that I'm watching on this four-hour chart here 90 days four hours is that orange rising 20-period moving average it seems to be offering up a little bit of support even though Price action might be getting a little bit tired on this 30% bounce so quickly into the $100 level some traders going to watch that moving average
Hoping that it holds up here could be difficult on a day with broad market weakness Of course, but if we were looking for an area of potential horizontal support if it were to break that orange 20 period moving average Perhaps the $92 ledge beneath us could be that level It's a coincident with what was the 50 period moving average on this four-hour bar chart So we'll see if that holds but it makes sense to get a little bit of a pause after such a fantastic pop following the news driven rally here Okay, all right, and let's zoom out for a longer term chart. What does that look like Kevin? Yes, I'm same thing basically a couple of layers beneath us for bulls to maybe set some risk First level might be that $90 and 50 cent ledge That's basically the low of this major gap move we made in the last six sessions here So 90 and a half at that level beneath us if we were to find 87 that would be fine too That's the 50 day moving average, but also half of the move we've made up
So we often will get big spikes one way or the other spike to the upside or the downside But after a move of this nature if we were to give back half of it and hold it could be stated that we have the opportunity for Continuing this new short-term uptrend. Well, that would be coincident at the 50 day moving average So if you're a trader looking and understanding trends price action Yes, we can get weakness But where we fall to and stop the selling is just as important as anything else So have those levels set know where you want to take action as always All right good stuff that is Kevin Horner senior manager trading services Charles Schwab. Thank you Kevin
More episodes
More from Schwab Network

Stock Market Today: ORCL & ADBE Earnings, AEO Plunges Near 52-Week Low
Schwab Network

Thursday's Final Takeaways: Crude Taps $103 & PPI Hotter than Expected
Schwab Network

Balancing High-Conviction AI With High-Dividend Diversification
Schwab Network

EARNINGS PANEL: ORCL, ADBE
Schwab Network