About this episode
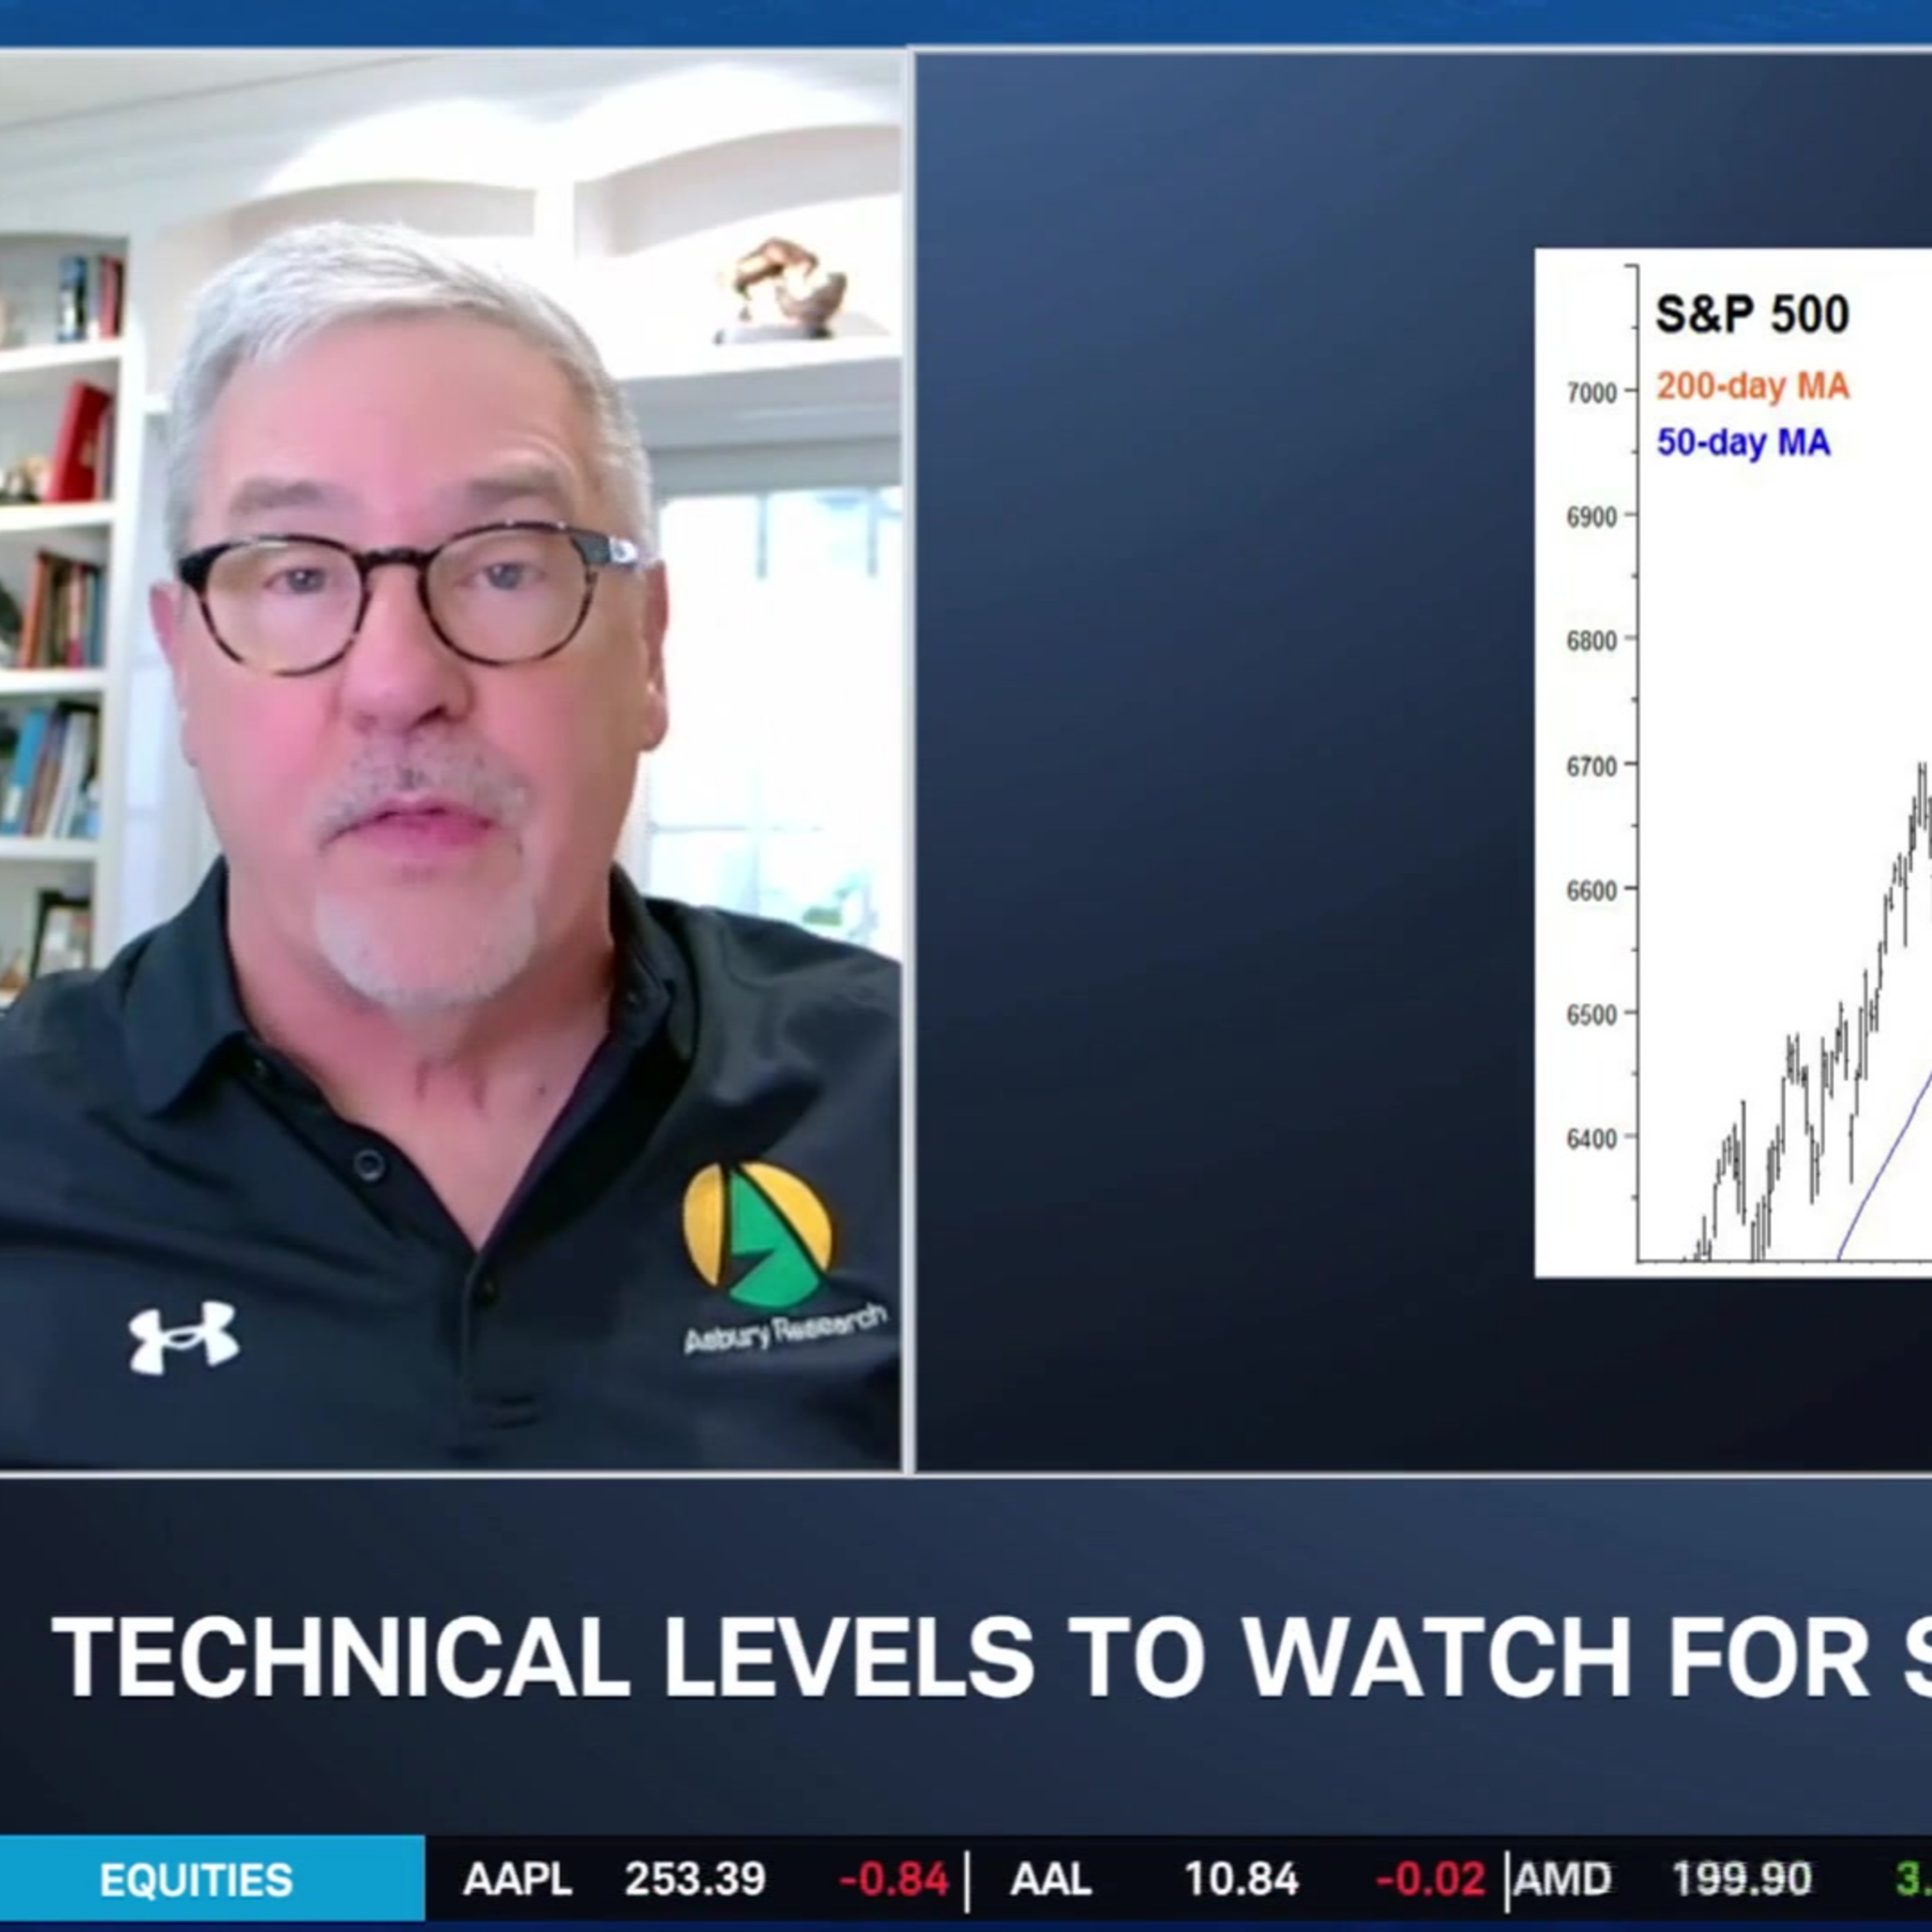
John Kosar shares the latest Asbury 6 metrics, a way of measuring market health. All six metrics turned red as of March 6, and John explains what that could spell for market movements. “The market’s vulnerable to more technical weakness.” He looks at support levels for major indexes and argues that “by early next week,” if the market doesn’t find footing, we’ll have a “tough start to the second quarter.” John also looks at the S&P 500 by sector, measuring inflows and outflows.
======== Schwab Network ========
Empowering every investor and trader, every market day.
Options involve risks and are not suitable for all investors. Before trading, read the Options Disclosure Document. http://bit.ly/2v9tH6D
Subscribe to the Market Minute newsletter - https://schwabnetwork.com/subscribe
Download the iOS app - https://apps.apple.com/us/app/schwab-network/id1460719185
Download the Amazon Fire Tv App - https://www.amazon.com/TD-Ameritrade-Network/dp/B07KRD76C7
Watch on Sling - https://watch.sling.com/1/asset/191928615bd8d47686f94682aefaa007/watch
Watch on Vizio - https://www.vizio.com/en/watchfreeplus-explore
Watch on DistroTV - https://www.distro.tv/live/schwab-network/
Follow us on X – https://twitter.com/schwabnetwork
Follow us on Facebook – https://www.facebook.com/schwabnetwork
Follow us on LinkedIn - https://www.linkedin.com/company/schwab-network/
About Schwab Network - https://schwabnetwork.com/about
Get every episode summarized
Each time Schwab Network publishes, we email you a written briefing from the transcript — the topics, who appeared, and any specific claims, with the ad reads skipped.
Email me new episodesFree for 3 shows. No card needed.
Transcript ready
82 searchable segments. Every word is indexed and playable.
Full transcript
Schwab Network — Asbury 6 Goes Red: What Market Internals Signal. Machine-transcribed; use the interactive transcript above to jump the player to any line.
All right, moving on and welcoming in our next guest now. Joining us, I'm very pleased to say, is John Kosa, portfolio manager at Asprey Research. John, it's always lovely to have you. The Asprey 6, the EKG check for the market. I'm seeing a bit of red on the screen. Just walk us through what that means. What it means is that the internals of the market have started to turn negative as of March the 6th. So, about 10 days, about 10 days ago. When they're all red, it just means that these various internals that we track, like the rate of change in the S&P 500 there it is on the screen, relative performance between stocks and high yield bonds, investor asset flows, volatility, trading volume and market breath. We do this because you can really get knocked off your game if you're just staring at the S&P 500 all day because we're up 100 today. We're down 100 tomorrow. We've been really drifting sideways since the end of October. This kind of helps us to
understand kind of internally what's going on in the market. We call it an EKG for the market. I think that's an accurate metaphor. So right now it's telling us the market's vulnerable to more tactical weakness. And it's important to check on the internals when you've got a relative calm and resilience at the index level. We've been watching a lot of that churn under the surface. So, obviously flashing red across your A3-6, but we have also at the S&P 500 level tested the 200 day moving average over the last week or so. Obviously we've picked up to start the week. We've fallen through 6700 once again this morning. Just talk us through what levels you're watching right now on the index. Well, just like you said, it's the 200 day moving average. The interesting part of that and I'm looking at a little post it here because there's a lot of them. The NASDAQ composite and the NDX both are testing their 200 day moving
average. So, it's Nvidia. So, it's Tesla. So, it's the OEX. So, it's small cap. There are also 2000. So, it's mags, which is the ETF, the Tracks to Mag 7. So, we've got a lot of really influential, important stock index that are all sitting on those major support levels. So, to me, that's the next best thing to knowing what the market is going to do next week, which nobody does. Is the market needs to find its footing here. I would say within the next week, by early next week, if it doesn't and we start to leak through these levels and the OEX is really close to doing that. The OEX, which is the S&P 100, has been underperforming the 500 for months. That's typically a negative internal signal for the market. So, that's really what we're watching. The market needs to hold in right here, or we're going to have a tough start to the second quarter.
Right. Let's talk about some of the sector breakdowns as well, because it has been characterized by a lot of rotation under the surface, as we know. I mean, obviously, energy has been benefiting from these higher oil prices. Just talk us through what you're seeing as far as the sector breakdown, some of those flows into various pockets of the market and what is outperforming and what's not doing so well. Sure. So, what we're looking at is when you bring up the graphic, there it is. So, this is a model that we developed probably seven or eight years ago. And what it does is it measures the velocity of money that's moving around the 11 sector spiders. So, these aren't telling us what's outperforming on a chart. It's telling us where the money is going and where the money is coming from. So, right now, you can see the top three are energy, and it has a one all the way across the chart. So, that means in three different time frames, which is trading, which is a week technical, which is a month in strategic, which is a quarter. All three of those time frames are attracting
money the fastest from energy. The next two are utilities and technology, but no technology. It's rated. We got a two and a three in the trading and the tactical, but the strategic is still 10, which is second to last. That means some new money is coming into technology now. If you look at the bottom, financials and health care are the two where the money is coming from. So, if you're looking at this as kind of a zero sum game, and the money is rotating around the sectors, that's the way it sets up. When I was with you here last, it was in February of the 11th, we talked about energy was number one. It's still number one, and energy is, I'll perform the S&P by 30% since January the second I think it is. So, the SEAF model is actually outperforming year-to-date, outperforming the S&P by about 9%. That's on the strength of identifying energy and industrials a little bit earlier, and utility isn't getting on those ideas very early before they started to outperform. That's because we're tracking money movement and not
relative performance. So, John, when you tie all those metrics together, I mean, what is that telling you right now? I mean, what do you get from all of that messaging, from the data that you collect and what you see on the screen? I mean, as you say, I mean, the conclusion that you're drawing as we could be entering, what could be a pretty tough Q2? I mean, obviously, we're starting to get a corporate read from some of the companies as to maybe a window into these Q1 earnings now. We heard from Delta yesterday and Honeywell, but what does it tell you then? What do you do with this big numbers? Yes. So, what we do is we identify unusual relationships, relative performance relationships. We're tracking assets as they move from place to place, then we basically throw them into the computer and see what comes out. So, when energy utilities and technology are all performing while financials and healthcare are underperforming, the market is usually reflecting a mixed or transitional
macro environment rather than a clear economic phase. It often occurs when investors are uncertain about growth, but still expect inflation or structural growth in certain industries. So, that's kind of what it all means from a more of a financial or an economic basis, but we've got a lot of geopolitical pressures out there now. So, that's a wild card. That's an uncertainty aspect of this market. So, I think you really have to be careful here. Let's put it this way. If you're a tactical trader and you like the market, this is a very low-risk place to try to buy the next leg higher in here. But again, if we can't hold a 200-day moving averages and all these various ETFs and index that I just ran a lot of a couple of minutes ago, we're rolling into a deeper move down. And again, we could have a rough second quarter. So, it's all about whether
these levels hold here over the next week or so. Yeah, and a lot of this has been driven by the headlines coming out of the Middle East. So, I think you know, the markets are eyeing duration on this conflict. John always appreciate it. Thanks so much for getting us across your channel this morning. John Cosa, Portfolio Manager, Asprey Research.
More episodes
More from Schwab Network

Stock Market Today: ORCL & ADBE Earnings, AEO Plunges Near 52-Week Low
Schwab Network

Thursday's Final Takeaways: Crude Taps $103 & PPI Hotter than Expected
Schwab Network

Balancing High-Conviction AI With High-Dividend Diversification
Schwab Network

EARNINGS PANEL: ORCL, ADBE
Schwab Network