About this episode
Prosper Trading Academy's Scott Bauer sees great trading opportunities in a geopolitical-driven volatility spike. He points to TSMC's (TSM) sharp decline, gold's resiliency, and Goldman Sachs' (GS) nearing major support as his latest opportunities. Scott offers example options trades While Rick Ducat backs the trades with technical analysis for today's Big 3.
======== Schwab Network ========
Empowering every investor and trader, every market day.
Subscribe to the Market Minute newsletter - https://schwabnetwork.com/subscribe
Download the iOS app - https://apps.apple.com/us/app/schwab-network/id1460719185
Download the Amazon Fire Tv App - https://www.amazon.com/TD-Ameritrade-Network/dp/B07KRD76C7
Watch on Sling - https://watch.sling.com/1/asset/191928615bd8d47686f94682aefaa007/watch
Watch on Vizio - https://www.vizio.com/en/watchfreeplus-explore
Watch on DistroTV - https://www.distro.tv/live/schwab-network/
Follow us on X – https://twitter.com/schwabnetwork
Follow us on Facebook – https://www.facebook.com/schwabnetwork
Follow us on LinkedIn - https://www.linkedin.com/company/schwab-network/
About Schwab Network - https://schwabnetwork.com/about
Interactive timestamps
Jump to segmentGet every episode summarized
Each time Schwab Network publishes, we email you a written briefing from the transcript — the topics, who appeared, and any specific claims, with the ad reads skipped.
Email me new episodesFree for 3 shows. No card needed.
Transcript ready
292 searchable segments. Every word is indexed and playable.
Full transcript
Schwab Network — The Big 3: TSM, GLD, GS. Machine-transcribed; use the interactive transcript above to jump the player to any line.
0:00And it's time for the big three. We've got three stocks, three charts, and three trades for you today. Richter Cat, of course, will take us through the charts and here to take us through the trades today. Scott Bauer, the CEO over at Prosper Trading Academy. Scott, great to have you with us. A bit of a wild day. We are off of session lows, but still firmly trading down in the red here. A lot of concerns about oil prices. We're right about 100. I think we dipped under, we're dipping under 100 now, but still very close to that level. What are your thoughts on how we're kicking off the action this week? I mean, volatility and we don't know what is next quite frankly. And what's really unreal is that in the same day, it's possible that we're going to see the biggest spike in oil prices and the biggest decline within the same day. So, you know, the market is trading on every last bit of news, every latest news that comes out, especially in relation to what's going on with the straight and tankers getting through. So, I think people trading in this market,
1:00it's fantastic, fantastic for day trading. Traders, I love this volatility. And if you're looking for a little bit longer timeline on whether it's an option play or just looking into some stocks or whatever, pick where you want an entry to be and then just start kind of peace-mealing your way in. All right, so speaking of picking an entry and where you want to be, your first pick today is Taiwan semi. On the year, doing very well, a bit over the last month has been dragged down sort of more broadly with the market trading lower. You know, does that come into why this is our first pick today? Yes, and I think it's way oversold. It is down to some really major support. And, you know, there's so much of what goes into a decision and, you know, is the overriding geopolitical issue, is that gonna de-escalate a little bit as a going to escalate a little bit. But, you know, it is a long time trader here.
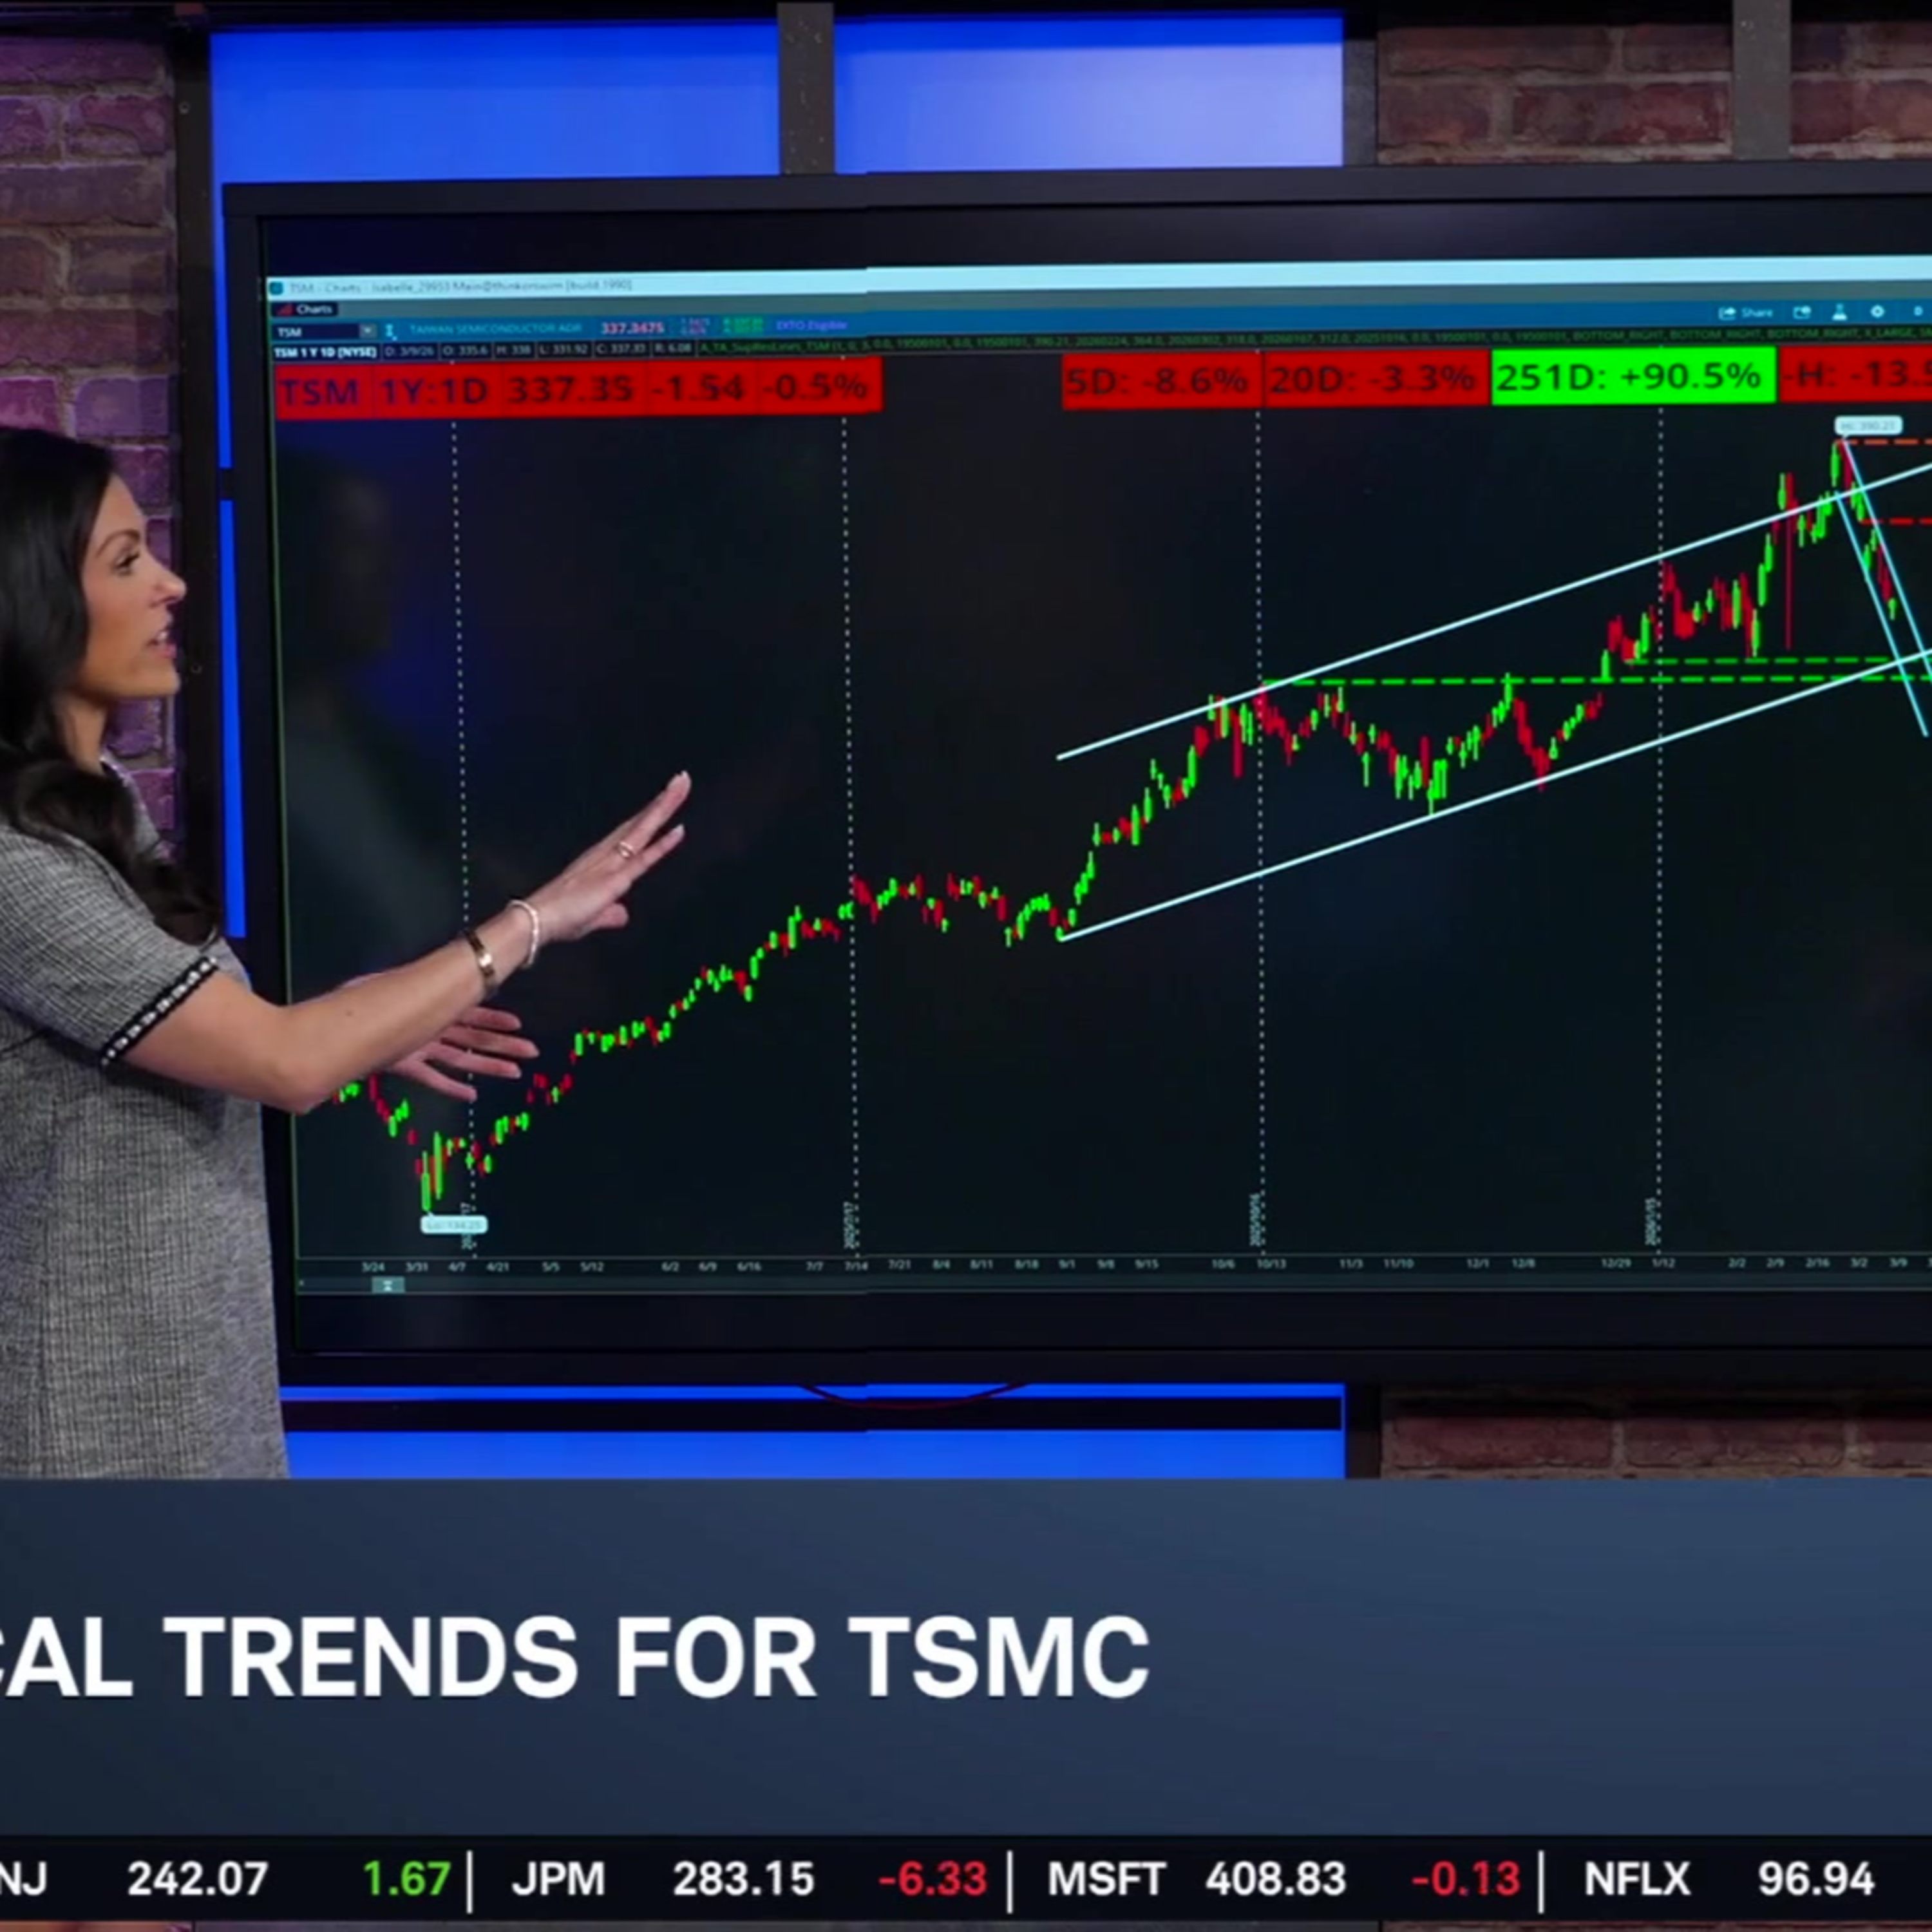
2:00I'm looking at technicals, I'm looking at fundamentals. I love Taiwan semi. The reason that I am putting on an iron condor is because option premium implied volatility is so expensive. So this is a position that is bullish. I am looking for somewhat of a range, but it is bullish, but I'm able to collect a lot of premiums. So I'm selling this week's pretty much at the money put spread, 3.35, 3.30 puts spread. I'm also selling to collect more premium, the upside 360, 365 call spread, collecting $2.60 on that. My risk is $2.40, I love this position. All right, Rick. So as we take a look at the technicals here on Taiwan semi on TSMC here, we've seen that they've had this really nice uptick. They are higher on the year, but a little battered over the last month. Yeah, it kind of reminds me of the expression, the bear, or excuse me, the bull climbs the stairs, the bear jumps out the window, because we have this more gradual ascent and then a very sharp swift decline.
3:02That's often the case in trading. You know, be prepared if you start to see things start to roll over at a notable high point here. But now we have a very narrow, very tight, downward sloping channel type shape in blue here, starting with those highs near 3.90. So we're still in the midst of this here. One gap level that stands out right about here near 3.64, we haven't quite filled that gap yet. So that stands out as a potential upside resistance area. To the downside, we had a double bottom type of pattern here near 3.18, just below that 3.12 or repeated ceiling here. So that was also where we had a low point after our gap up. So that means that this area here stands out as a potential supportive area. Also, it would be pretty close to this longer term trend line as well. Those things would all kind of come together right around that same area. When we look at our moving averages that we follow here, we can see that we are right now trading near our gold quarterly 63 day EMA coming in right around 3.36.
4:03So this is a notable longer term EMA. It'll be interesting to see if price hangs on and can stabilize at this important moving average here that traders would often use as a support during uptrends, resistance during downtrends here. RSI, moving lower, we are breaking our downward slope, or excuse me, upward sloping green trend line here, we have our downward sloping red trend line still in play. We are below the 50 midline here. So despite that, we're not too terribly low on the RSI. We're not oversold or anything yet here. So despite our decline, it kind of seemed like it was holding up a little bit better than you might expect to me at this time. Now, when we also look at our volume profile study, we are within the boundaries of this node here from 3.25 to about 3.40. So you can see that we have this spike in trading activity. Things start to pick up again here near 355, but the major important area on this chart here, between about 284 to 305, our point of control
5:05is included in that area near 294, the heaviest volume area of all. That's the real standout area from this perspective. All right, and right now as we look at TSMC, they are trading at 3.36, 81 just down slightly today, but on a down day in the markets. Let's move to your second pick here, Scott. You've got the spider gold ETF here, ticker GLD. Take us through this one. Rinse repeat, it's really the same explanation is what I'm seeing in Taiwan semi. So because of the just inflated implied volatility option premium, I want to sell another iron condor that expires this week. This also has a bullish tilt to it. So I'm selling this week's 465, 460 put spread on the upside, the 480, 485 call spread. This one I collect $3. So the ultimate risk on this, if GLD made a big blowout, move one direction or the other, is only $2.
6:07So again, a lot of option premium here, a big credit to collect. All right, so potential for a big credit here, but as we look at the technical setup, Rick, what's it showing us about where we might see some movement? Well, the picture is a little bit muddled right now, I would say, because we did have this very sharp rally to the upside here, culminating with these highs, just shy of 510. But from there, we had an equally sharp decline that took us back to this gap level here. From there, we formed an upward sloping pattern here, a rising wedge type shape here, where we have our two trend lines converging toward each other. But the lower one is more steep, the top one is more shallow, suggesting that we see increasingly anxious buyers and more relatively more consistent sellers here. So typically, this would be more of a downward bias type of shape here. We topped out here near 490. For now, it's looking like we are bouncing around near 468 or so. A couple of notable lows, 446,
7:10and 441 here, match up with some extreme low price points here. So those could be supportive areas, especially because they do line up with our longer term, blue trend line that was pointing up as well. When we look at our moving averages next, in this case, we can see that we are kind of stuck between our two shorter term ones, our dark blue weekly five day EMA, our teal monthly 21 day EMA. Those come in at about 471 and 467 respectively here. So very short term boundaries you could consider in your trading here. Meanwhile, our quarterly and gold down here, near 440, RSI, kind of a triangular shape here, but we are above the 50 midline and we are above our green trend line still. So look for perhaps this to solidify a little bit more and to make new relative highs, along with price. Finally, volume profile. This helps us identify where we had the most trading activity to give us potential ranges for consolidation, support and resistance. So we have our peak here between 450 to 470.
8:13So this is kind of a bigger range to consider where near the upper end of that part. But you can see pretty obviously there was a notable spike here near about 425 to the downside. So that could be a possible foothold. Notice as well, extremely, extremely heavy volume that we saw during this push to the upside. Look for things to pick up again in volume activity if we start breaking above once more. All right, right now we're at 467 trading down, close to one and a third percent today for the spider gold ETF, a similar move in gold this morning as well trading down about 1.2% for gold, right about 51-100. Now your last pick's got Goldman Sachs here. They've gotten sort of caught up on some of the beat down on financial, some of this credit conversation that's been going on and cockroach mumblings here and there. What's your take here and is your trade a long-term player or short-term play? It's another short-term play looking to take advantage of both major support with the 200-day moving average just below kind of where we're trading right now.
9:13And again, just like the other positions take advantage of really extreme implied volatility option premium. I love Goldman Sachs. I love JP Morgan, two of the best in class and the financials, but in Goldman, what I'm looking to do is sell next week. So it's not this week. It is next week's March 20th expiration selling the downside $7.90, $7.80 put spread, $10 wide, looking to collect about $4.50 for that. That is also a very nice amount of premium. And on this one, the way that I'm looking at it is my break even on the downside end of next week is $7.85.50. If Goldman were to get down there, I'm a buyer at that point anyway in the stock. So this way I'm playing it with really expensive options, collecting a credit, and we'll see what happens. All right, we'll see what happens, but Rick, as you look at the technical setup here, what is it here? Sure, mostly the trade would be looking for our lows of today to hold on.
10:15So the kind of hoping that this would be a line in the sand at which the bulls would regroup and kind of send prices back up higher. For, or excuse me, $8.26 and $8.40 were some notable high points here. That's around where we saw prices see some slowdown and stopping here. But for now, we have solidified more toward the downside. We had a downside breakout from our downward sloping channel type shape and white there. We had notable fluctuations here. You could argue that we had kind of this general range between about $8.70, probably around $9.60. That's where price typically topped out more we did have those highs, just shy of $9.85. But that was our range for a while. So now we're below that point. So look for that area in particularly $8.70 to be a notable resistance point that the bulls would want to retake. So now when we see our moving average, in this case, we have kind of nice different examples of our moving averages of our charts here. Now we're seeing one that's more in decline. So our faster moving averages are starting
11:15to overtake our slower ones. Particularly today, you can see our teal 21 day crossing below our gold 63 day. Not exactly the greatest trading signals in and of themselves, but an easy visual cue to see which way the trend is going and the way things are progressing here. Look for potential support here at our long term, 251 day EMA in orange, 769 is where that one comes in. That's our yearly EMA. RSI showing a pretty consistent downward slide. We did see some bearish divergence here despite RSI going into that overbought area. For now, we are on the verge of slipping into that oversold area though. So a move below 30, a close below that level on the RSI would be noteworthy here. That would be potentially regards a sign of further weakness to come in a trending market. Now when we also see the important volume nodes, we are coming up right to the most important one of all between about 770 to 800. Our point of control, our thick red line there, sticks out at 782. So this would be a very significant area
12:16for the bulls to hold onto. They would want to solidify there and get a bounce back to the upside. Hopefully they would be targeting this area here between about 900 to 950 roughly. All right, and we are trading above that yearly EMA that you highlighted right now at 8, 10, 79, but down slightly just on the day here for Goldman Sachs. Scott, we want to thank you for being with us today for big three and for bringing those picks and trades for us, Scott Bauer, CEO of Prosper Trading Academy. And of course, thanks to Victor Catterlead Market Technician for always breaking down the technicals for us.
More episodes
More from Schwab Network

JNJ Balances Growth, Patent Transitions, and Legal Overhangs
Schwab Network

nCino (NCNO) CEO on Earnings, AI in Banking & Overcoming "SaaS-pocalypse"
Schwab Network

The Big 3: NET, TWLO, ASTS
Schwab Network

Tie Lasater on Inflation Floors, Energy Risk, and Private Credit Stress
Schwab Network