About this episode
From high-beta names to consumer reliables, Elliott Wave Trader's Tammy Marshall talks about stocks with breakout potential through her Fibonacci analysis. She takes investors through example options trades in Rocket Lab (RKLB), Monster Beverage (MNST), Walmart (WMT). Kevin Green offers technical insight by highlighting key levels to watch.
======== Schwab Network ========
Empowering every investor and trader, every market day.
Options involve risks and are not suitable for all investors. Before trading, read the Options Disclosure Document. http://bit.ly/2v9tH6D
Subscribe to the Market Minute newsletter - https://schwabnetwork.com/subscribe
Download the iOS app - https://apps.apple.com/us/app/schwab-network/id1460719185
Download the Amazon Fire Tv App - https://www.amazon.com/TD-Ameritrade-Network/dp/B07KRD76C7
Watch on Sling - https://watch.sling.com/1/asset/191928615bd8d47686f94682aefaa007/watch
Watch on Vizio - https://www.vizio.com/en/watchfreeplus-explore
Watch on DistroTV - https://www.distro.tv/live/schwab-network/
Follow us on X – https://twitter.com/schwabnetwork
Follow us on Facebook – https://www.facebook.com/schwabnetwork
Follow us on LinkedIn - https://www.linkedin.com/company/schwab-network/
About Schwab Network - https://schwabnetwork.com/about
Get every episode summarized
Each time Schwab Network publishes, we email you a written briefing from the transcript — the topics, who appeared, and any specific claims, with the ad reads skipped.
Email me new episodesFree for 3 shows. No card needed.
Transcript ready
245 searchable segments. Every word is indexed and playable.
Full transcript
Schwab Network — The Big 3: RKLB, MNST, WMT. Machine-transcribed; use the interactive transcript above to jump the player to any line.
It's time for the big three. We've got three stocks, three charts and three trades. Kevin Green will be taking us through the charts here to take us through the trades is Tammy Marshall analyst at Elliott Wave Trader. Great to have you both with us today. Tammy, I'd love to get your thoughts on the market action we're seeing to start off this trading week, particularly with the events we saw this weekend. I was just speaking to Nicole Petalidis on the floor of the NIC and she likened the traders as firefighters waiting for the bell to ring. They're at the ready. What are some of the things you're noticing so far this morning? Well, lots of volatility. I really like the bounce that we've had in the market so far this morning, but I have to be honest with you. I don't necessarily trust it. I could see this market going either way at this point. We could either continue to bounce throughout the day or possibly run into some resistance and turn around and continue to move down. So I can make a case for the bulls or the bears. I want everyone to remember that we have quite a few of the moving averages on the side of the bears. We're holding that above the 200 simple,
but just be cautious out there. All right, so let's move into your first trade then your first pick for the big three today is Rocket Lab. This is not a new one for us in the big three. You're not the only person who likes this one. Pretty much flat on the year in positive territory, but did just report a record annual revenue. So walk us through this one and what your trade would be here. Yeah, Rocket Lab has defined Fibonacci risk of 60 to 65. It's a pretty big cluster that I have on my chart. There again, we do have a few of the moving averages on the side of the bears, but we're still holding above that 200 simple. So I can still make a case for the bulls here. And as long as your risk is defined, you can keep those losses minimal in case we do turn around and continue to move down. But just remember that Rocket Lab did just have great earnings. It did pull back some because of the expected delay of the Rocket launch. But I'm still looking to get bullish on Rocket Lab have been bullish for a very long time. And I'm looking to add to that position. I have a simple call debit spread for you for the 17th of April.
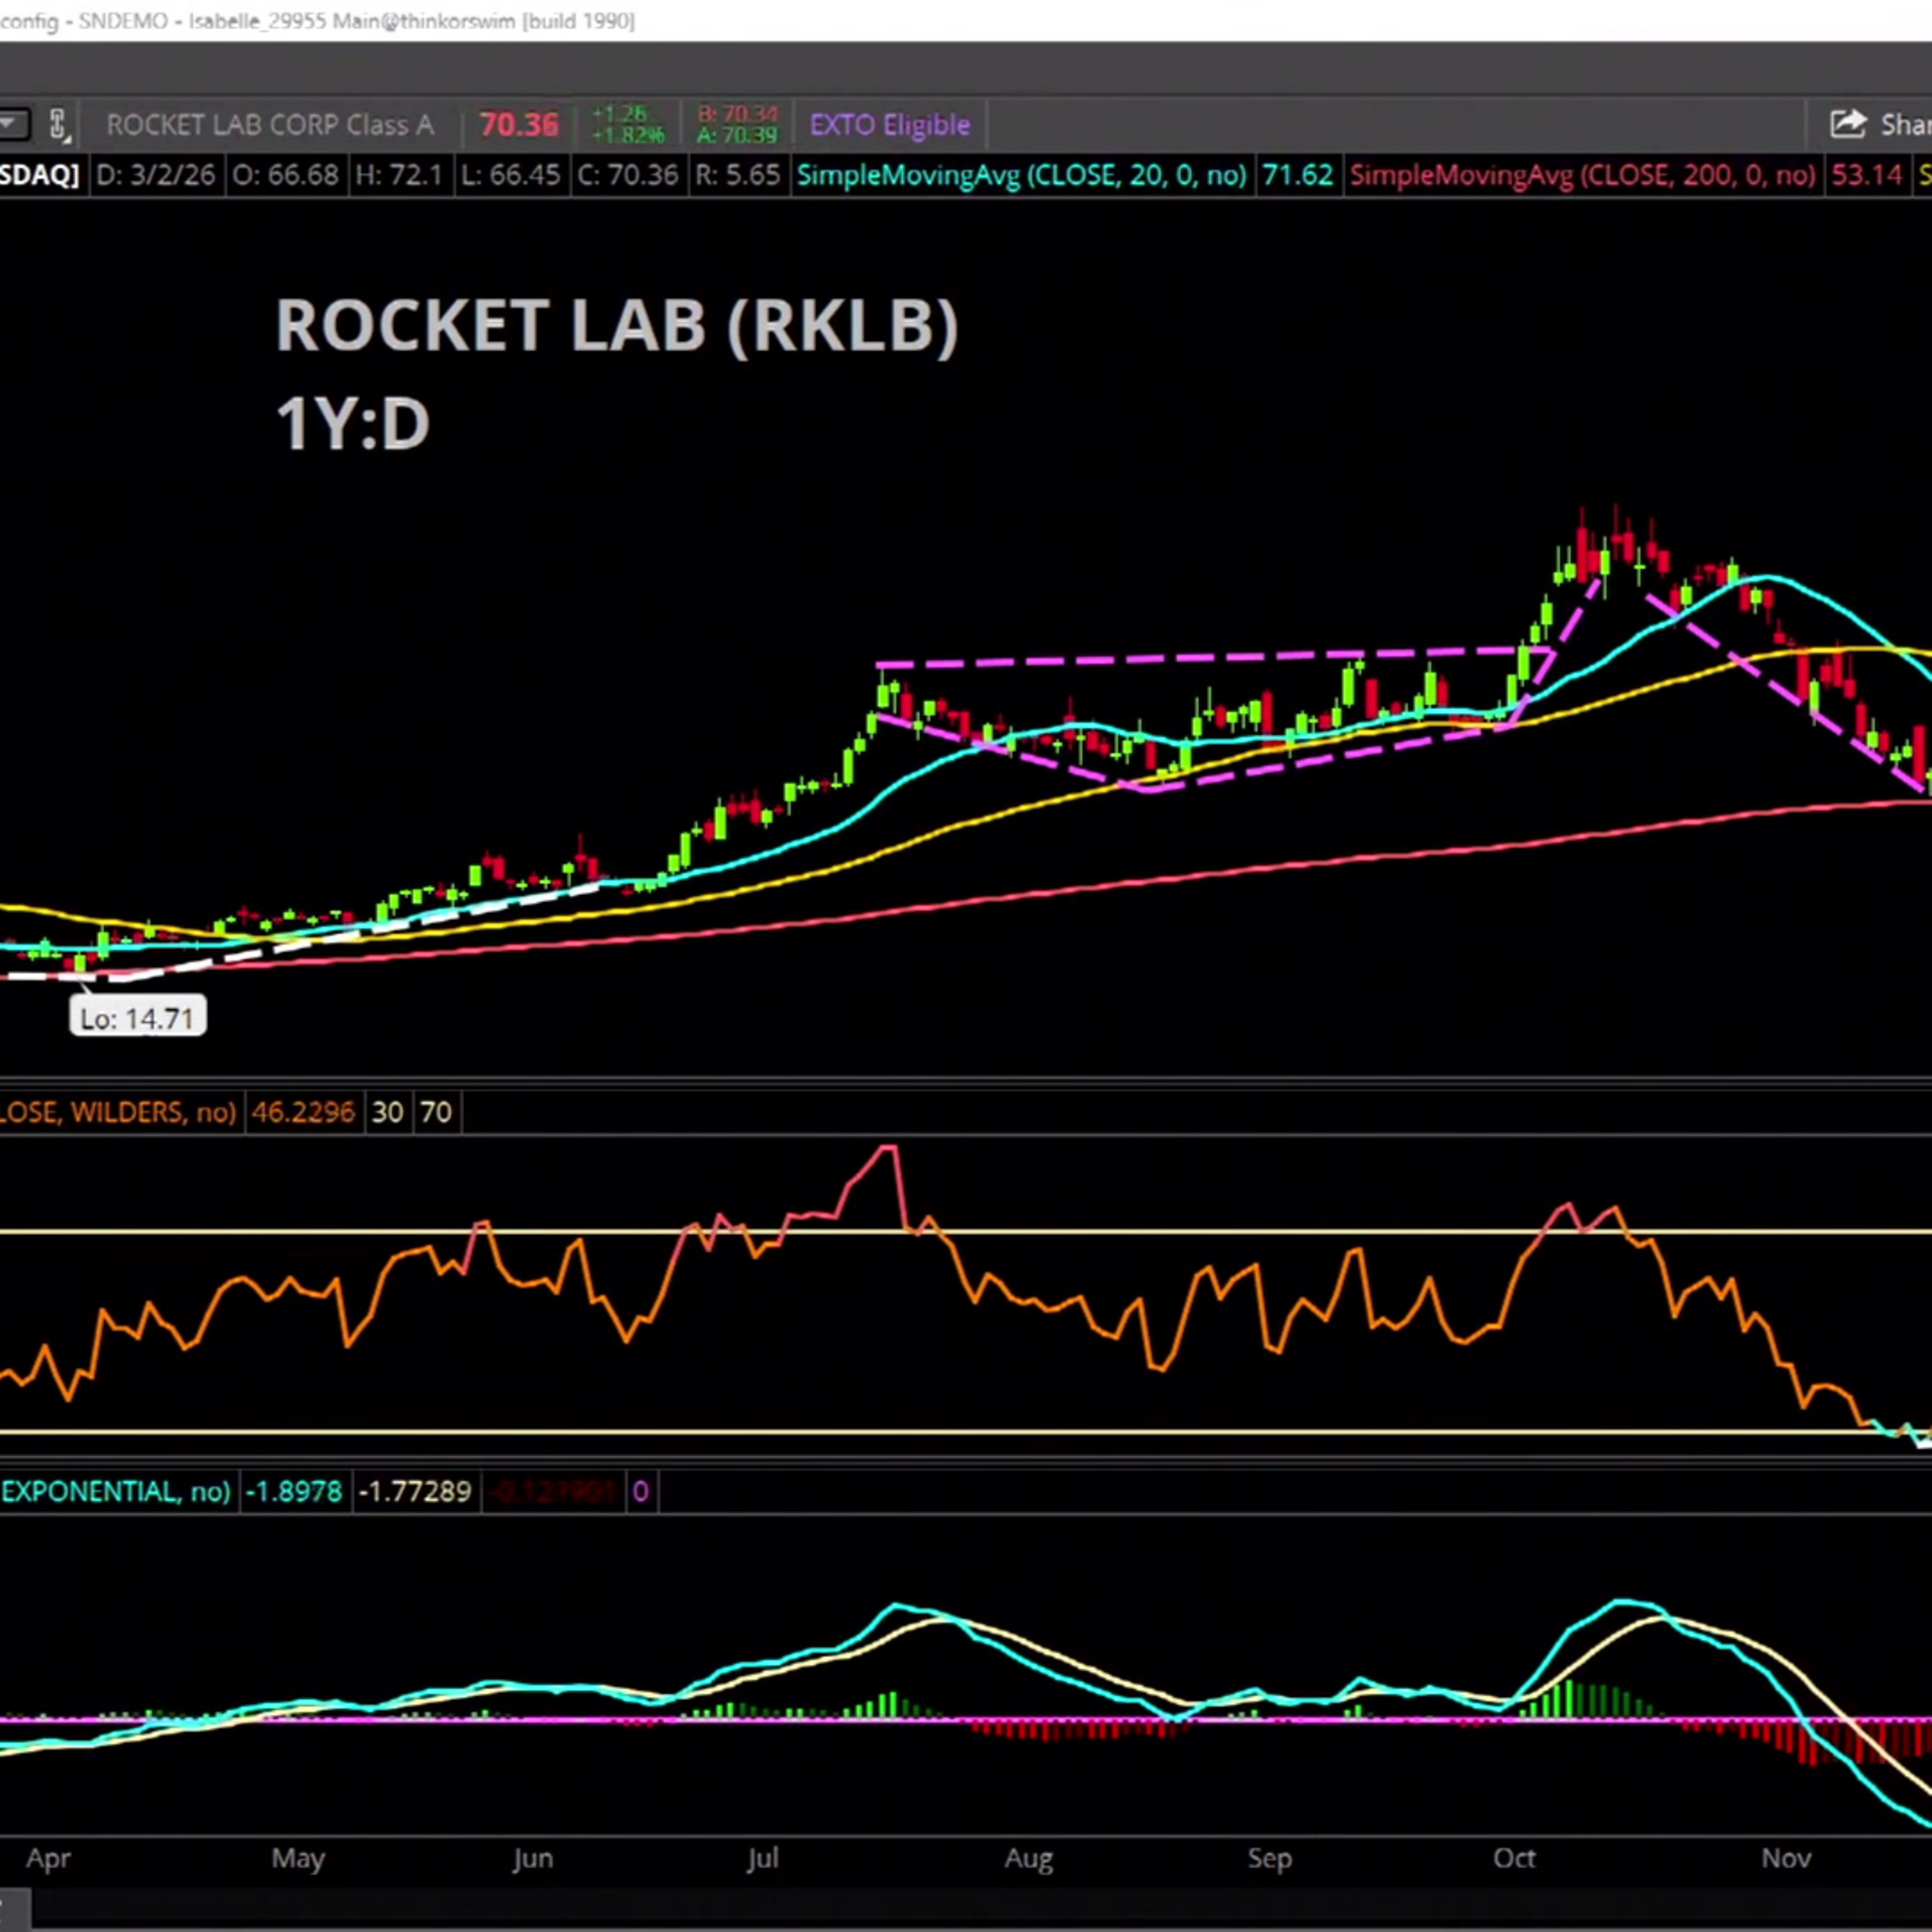
We have a 20 point expected move, which gets us to about $90. So we'll use the 70th of April. And it's a 75 to 90 spread, which cost about $4. So you're risking 400 to make a max profit of 1100. All right, so KG is we take a look at the technicals for Rocket Lab. You know, in the last 52 weeks, up almost 250%. But year to date, you're not quite performing as well here. What are you seeing in the technical setup? Well, this stock has actually done a pretty decent job over the last year. And what I actually like about it is the fact that it does kind of consolidate base out. And then it does break out a little bit higher. And I think that's probably what we are seeing at this point in time. If you look at this time last year, we had this basing formation at around $14.70 or so, hitting that 200 day moving average. And you saw some buyers really trying to step in. And once again, we kind of have this consolidation pullback, leveraging at 50 day moving average in yellow as an area of support, and we've been able to move higher. Now, what we are seeing right now,
the stock did hit $99.58 back earlier this year. And now it is kind of pulling back here a tad bit. But some buyers have actually stepped in at that $65 level. So we kind of have a situation where we are testing the 20 day moving average at the upside right now. Next area of resistance is $77. But if this is the start of the base and potential break out once again to new highs, you can make the case that it could go back and retest that $99 or let's say that $100 level. MacD's kind of flattening out as well. Maybe potentially setting up for bullish cross with the 12 BMA above the 26 EMA. And RSI is still making higher lows. So you can get a little bit confident with this name. It breaks down further from here. You're looking at the 200 day moving average at $53.14 as your next area of support. All right, and let's take a look now at your next pick here. We're talking about monster beverage here. Having a bit of a down day today, actually, down almost three and a half percent. But performing well on the year up almost 8% take us through this one, Tammy. Yes, master inner drink is doing great. It has all the moving averages on the side of the bulls.
Here again, I love my Fibonacci defined risk. That zone is 80 to 82. Long term, it has just been really a great chart with a lot of momentum. We just had earnings at strong quarter, but not necessarily great. However, a little light on profit. Lots of upgrades are centered around the $90 to $100 price targets. Let's give it time to work. I have a call debit spread for the 17th of April. We'll give it an expected move about six is about six points. So that'll give us to get us to about $90. You risk, let's see, it's $1.40 contract. So you risk in $1.40 to make a max profit of about $360. And of course, here again, I say this whenever else I've been on the show, just be sure to size up. If you'd like to size up or make the trade based on your account size, because I'm going to do probably about 10 of these contracts myself. All right, yeah, it depends on your comfort level
and the amount you want to spend, but can certainly always double triple quadruple, whatever you want, any of these suggestions. Kevin, as we take a look though at the technicals here, are you seeing the possibility for this momentum to continue? Yeah, I mean, this is actually probably one of the more simple charts that we've seen in the market in a very long time. If you actually look around this time last year, we did see a consolidated or a defined range to the upside looking at around that $60 level of major area support up to around that $68, $69 level. Now we have seen a breakout to the upside, making higher highs, making higher lows. We have well-defined resistance level that we did recently hit last week. We did see a little bit of a pullback, but we also have a support level that we have as well on that white line going from those lows. Now you are seeing the market pullback or the stock pullback to that 20-day moving average. It's going to be your major area of support. You have the support line, that trend line, once again, another area of support. And you can make the case that once again, it's going to maintain the trend and maybe go back to the upside and you're looking at around the $89, $90 level
is your next major area of resistance. Any breakdown, you're just looking at the moving average. It's the 50-day moving average. This is going to be the first one. And then the next area of support would be around $66. So higher highs, higher lows, well-defined trend to the upside. This one is, you trade the trend until it actually breaks and it has not broken yet. Yeah, George Tillis is his favorite. Don't fight the trend. He loves to say that whenever I do example trades with him. And then your last pick here, Tammy, is Walmart. We're about to come into a bunch of retail earnings this week, but you take us through Walmart, year-to-date performing well, outperforming the markets more broadly, of course, on the year in the last 52 weeks, also outperforming you. Walk us through this one. Yeah, absolutely. I wanted to give you some diversification, you know, away from tech. So we just had earnings, strong fourth quarter earnings, and they raised guidance. Long-term, the chart looks great. You know, there again, you know, I'm a bull until I'm not right when on some of these stocks. So it looks very strong, pulled back to the 20 SMA. I've got a simple call, Butterfly for you.
We'll go to the 17th of April to give it time to work. We have a 10 point expected move, which gets us to around $90. So that call Butterfly is targeted about 140. We'll use 130, 140, 150, which cost about $2 per contract. So one contract, it's $200 to make a max profit about 4,000 if we pen. If we don't pen, you could reasonably get up to about half of that 1,000 or 2,000. So that is a great trade on Walmart there. All right, so with that trade on Walmart, taking a look at the technical setup, KG, what are you seeing? Once again, higher highs, higher lows, well to find trend. There is a little bit of breakage when you're looking at the oscillators though. So if we're looking at the one year daily chart, we have seen a scenario where the stock really does find a pretty decent range to the upside. And that's exactly what we are seeing right now. Now the trajectory for Walmart, this is a little bit out of character. So we have to be mindful of that because it is a staple.
But if we continue to have this rotation trade taking place, the inflows on the staples are obviously going to flow into Walmart right now. It's testing that 20 day moving average. You'd like to leverage that as an area of resistance. Right now, area of support, right now, it's acting as an area of resistance. So let's just be mindful of that. If we do break lower, you're looking at $120. That's gonna be the next major area of support that 50 day moving average and anything below that, looking at $106 at 200 a day. Here's where you get a little bit concerned. We are starting to see how bullish or bearish divergence on the RSI where it is making lower highs as the stock is relatively making higher highs. And so this is just showing that price momentum is waning for the time being. The 12 AMA is also below the 2060 AMA on the MACD, but it's trying to hinge higher here. Cautiously optimistic that this range does hold, but once again, if we break down below, let's say that 120 level, it probably could get fairly aggressive to the downside for Walmart. All right, right now, Walmart trading at 127.91. Wanna thank you both for being with us
for the big three today, Tammy Marshall, analyst at Elliott Wave Trader, or AKA the Fibonacci Princess, and Kevin Green for being with us to break down the technicals today.
More episodes
More from Schwab Network

JNJ Balances Growth, Patent Transitions, and Legal Overhangs
Schwab Network

nCino (NCNO) CEO on Earnings, AI in Banking & Overcoming "SaaS-pocalypse"
Schwab Network

The Big 3: NET, TWLO, ASTS
Schwab Network

Tie Lasater on Inflation Floors, Energy Risk, and Private Credit Stress
Schwab Network