About this episode
Dan Deming urges investors to stay nimble as markets grapple with crude oil, gold, and silver volatility. That said, he sees trading opportunities available in the markets. Dan offers example options trades for Oracle (ORCL), Johnson & Johnson (JNJ), and Starbucks (SBUX) while giving bullish and bearish commentary for his picks. Kevin Green offers technical analysis by looking at the stock charts for today's Big 3.
======== Schwab Network ========
Empowering every investor and trader, every market day.
Options involve risks and are not suitable for all investors. Before trading, read the Options Disclosure Document. http://bit.ly/2v9tH6D
Subscribe to the Market Minute newsletter - https://schwabnetwork.com/subscribe
Download the iOS app - https://apps.apple.com/us/app/schwab-network/id1460719185
Download the Amazon Fire Tv App - https://www.amazon.com/TD-Ameritrade-Network/dp/B07KRD76C7
Watch on Sling - https://watch.sling.com/1/asset/191928615bd8d47686f94682aefaa007/watch
Watch on Vizio - https://www.vizio.com/en/watchfreeplus-explore
Watch on DistroTV - https://www.distro.tv/live/schwab-network/
Follow us on X – https://twitter.com/schwabnetwork
Follow us on Facebook – https://www.facebook.com/schwabnetwork
Follow us on LinkedIn - https://www.linkedin.com/company/schwab-network/
About Schwab Network - https://schwabnetwork.com/about
Get every episode summarized
Each time Schwab Network publishes, we email you a written briefing from the transcript — the topics, who appeared, and any specific claims, with the ad reads skipped.
Email me new episodesFree for 3 shows. No card needed.
Transcript ready
152 searchable segments. Every word is indexed and playable.
Full transcript
Schwab Network — The Big 3: ORCL, JNJ, SBUX. Machine-transcribed; use the interactive transcript above to jump the player to any line.
It's time for the big three, three stocks, three charts and three trades. Kevin Green will take us through the charts and here to take us through the trades is Dan Deming, managing partner at KKM Financial. So great to see you both. Dan, let's start with really your big picture thought here on the overall market. Of course, every week is a new week, but consistent pressure is now, unfortunately, the theme dominating these markets. Yeah, Jenny, it is right now. There's a lot of headwinds, at least from a short-term perspective, particularly with the inflation data coming in higher than expected, the labor market appears to be hanging in there. And the short end of the curve is readjusted this week as we're seeing the two-year yield really moving significantly higher and a flattening of the curve. So there's a change in sentiment as far as what the Fed's going to be doing here the next several months, even though we are going to have a change in leadership there, nonetheless, the market may dictate what they can or cannot do. And I think that's what's creating the headwind couple that with obviously the Middle East tensions and
the uncertainty surrounding the energy and shipping. But yeah, short-term some headwinds, a big reversal in the metals markets, I think, primarily due to some degree as far as interest rate expectations. But again, you know, the market still hasn't really suffered too much damage given all the current situations that it's dealing with. So, you know, even though we're down today, it does feel like we're possibly going to be able to hold off the lows and to be interesting to see if we can get back to unchanged today, Jenny. Okay, and a name that has not been immune from some of this broader market and damage, unfortunately, has been oracle. Although we are higher today, we're up 2.4 percent, but we pulled back now about 21 percent on the year. And so walk us through your thinking here when trading oracle, given the fact we pulled back 55 percent from highs seen after two earnings reports ago. Yeah, yeah, I mean, that's the theme in some of these names as we're seeing them coming significantly off of those highs that they did see in the third or fourth quarter of last year. You know, I think when you look at oracle, the reason I'm focusing on this today's for the trade example is affected. I think that it has temporarily bought them,
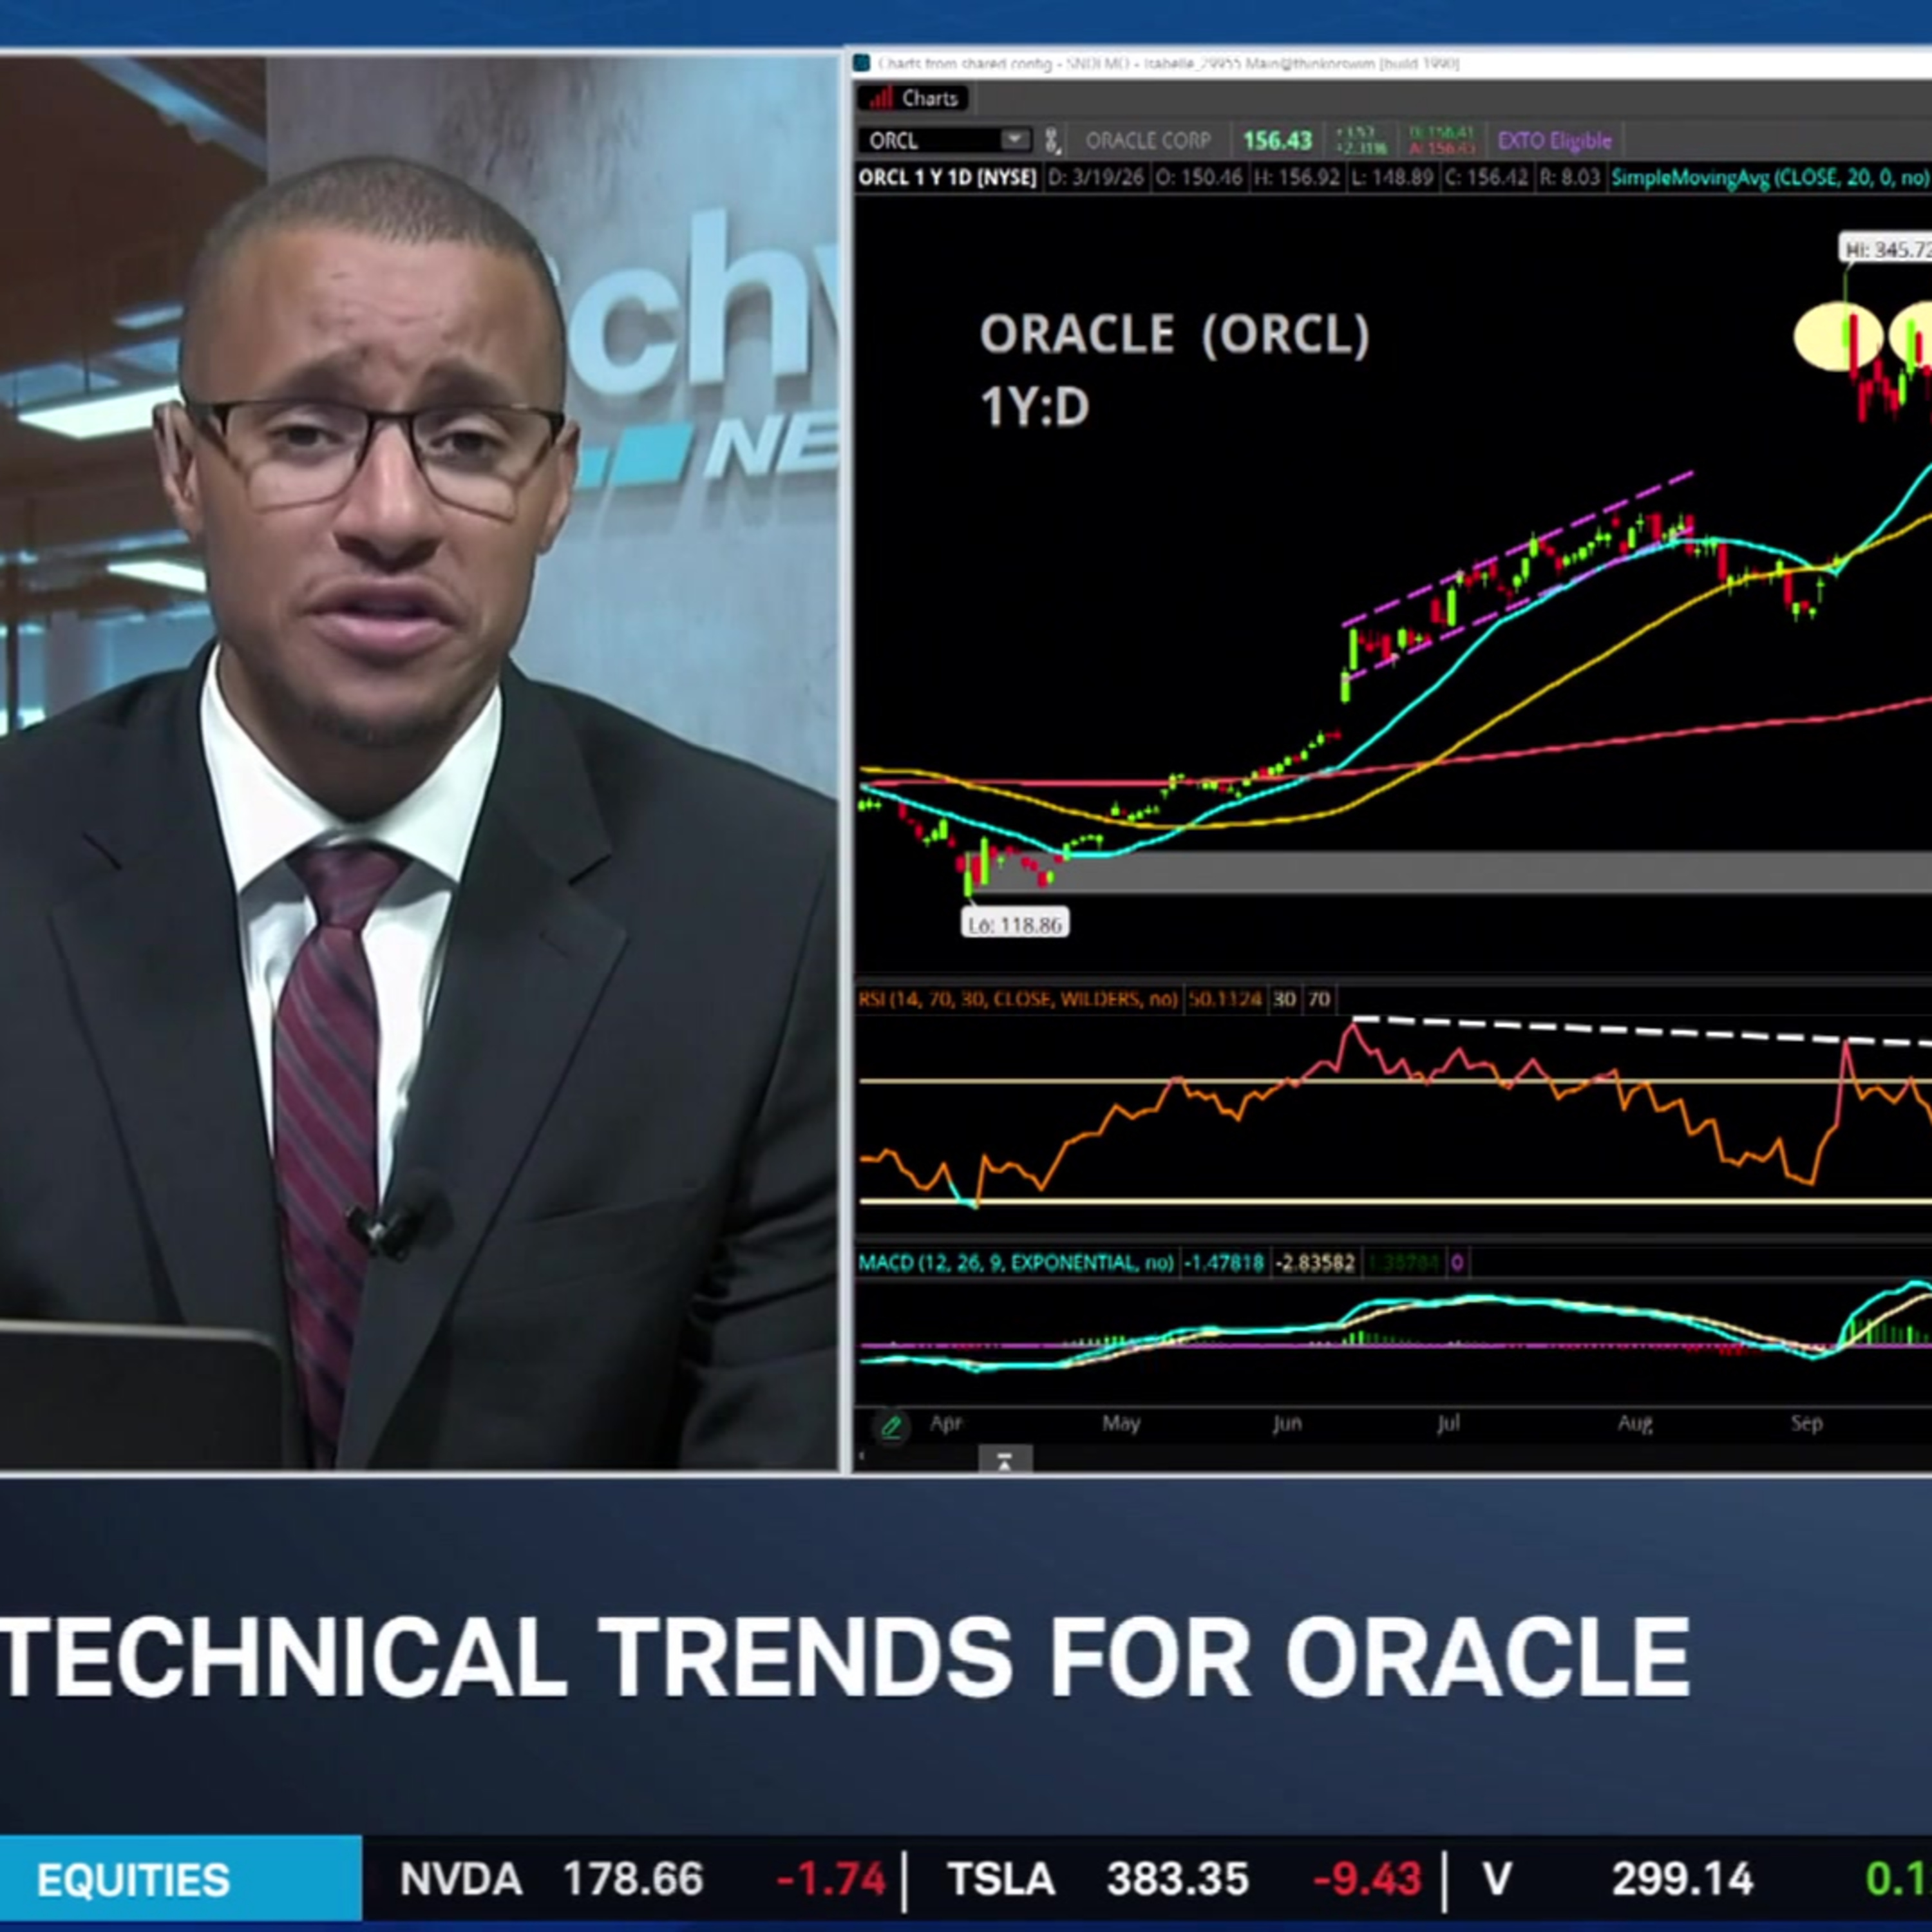
that I do think that we're going to find some upside here if the market finds some stability. And even if it doesn't, it looks like oracles been holding up relatively well. To me, it looks like there was a capitulation early February. We're finding some support here in this level around 155 to 160. And I think the potential here is for further upside. So that's why I'm focused on this name today. Okay, and so as far as now looking at the technicals, Kevin, walk us through your thoughts here because again, a name that's pulled back substantially, hopefully finding some firm footing here, but I mean, walk us through what your take is from a technical view. Yeah, you can make the case that maybe it has completed a short-term bottom. I would just be a little bit cautious. This looks like a bear flag to me, meaning that the primary trend is bearish or to the downside. And we are seeing a consolidation. In fact, we've actually seen this several different times over the last year. You can see that that consolidation happening back in December before breaking down. We have the same situation back in November. I started seeing maybe a potential move to the upside and then once again, kind of failing here. But you can also
make the case. And I think Dan's looking at this as well. This is a round trip type of move. You would have loved to see this get between 120 and 130 to really get a little bit more confident that maybe a capitulation bottom has taken place. We're still relatively close to that. If we're able to break out to the upside, you're looking at the 50-day moving average as your first major area of resistance, which is $163 right now. And then if you are able to break above that 175 and then you're looking at the 200-day moving average, I would look at the RSI as well. Right now, we did see a bottom. We are making higher lows. But the primary trend going from this kind of bearish divergent that we had while the stock was moving to the upside. To now maybe having a little bit of a bottom here gives you some optimism that near term, we might see some buyers stepping in. MACD, 12VMAs above the 2060MA, still below the zero line right now. But you like to see that formation for a bullish move here. I cautiously optimistic, but I would not be surprised if we go up test that 50-day moving average, reject, and then go back to that range that I talked about between that 120 and to a less than 125 level. Okay, now Dan, why don't you go back to you
for how we think through down trading this name here, given all of the technicals and the recent volatility we've seen in Oracle? Yeah, Kevin pointed out some key levels there, and I was looking at some of those levels as well. And so when you look at this, really, the trading sample of day is a buy-right, buying the stock here, and having the opportunity to capture some upside if we do see continued movement higher. But writing a May call, the May 180 call, about $4 and collect about $4 and premium lowers to break even to about 150 on the stock, which is still above the low end of the range. But again, at least it gives a little bit of a buffer or synthetic dividend over the next two months. And again, if we see the further upside, then Kevin pointed out the levels that I was looking at as far as potential resistance, particularly at 200-day moving average, where this is just above that. And if we see some weakness, then you get to own the stock here at the lower end of the range and also collect a little premium. So that's a thought process in today's trade example. Okay, now Dan, to move on to Johnson and Johnson, obviously a very different story,
but walk us through your thoughts here on how you trade a name like J&J, obviously, and start contrast with Oracle. Yes, yes. And again, this is a little more defensive in nature, and a theme to be as theme right now, as we're seeing some of these names holding up relatively well. And you know, Johnson and Johnson's come off its recent highs, but to me it's finding a level here that potentially build off of. And again, looking at this name, I think that the one thing that I'm looking at is I don't really want to cap the upside when I think about how to position myself. So today's trade example is a risk-reverse, so it's a capture further upside. And if we see some weakness, get put in the stock, because I do think longer term, it's a longer term hold if we do some weakness. So that's a thought process here today based on some of the dynamics in the stock. Okay, now, okay, G as far as the charts, we know that J&J is still actually higher by about 14% this year, also has still pulled back about 6% from these recent highs. But relatively unchanged today, a name that I will say has held up pretty well, all things considered over just the last 52 weeks or so. Yeah, Jenny says lower beta trade, so it doesn't move
in connection with the S&P 500 as much as, say, like an Nvidia for that matter here. This is actually a pretty constructive chart. If you look at around this time last year, we did see a consolidation, the stock traded at around that 141.45 level, found about them, was able to break above that 200 day moving average, and we have been in a bullish ascending channel ever since. Now, what's actually very interesting back in February, we did see a peak above that channel, we did see it kind of consolidate, and then starting to break down here a tad bit. So we are losing the 20 day moving average. Dan is right, if you're looking at from a bullish standpoint, that 50 day moving average has been a key area of support pretty much since July of last year. So he's kind of going with that first major level of support, but if we do see a breakdown, you could look at the 220 dollar level at your next major area, and if we break below that channel, it's the 200 day moving average at 194 spot 1517. The thing you get concerned about at the RSI, so we are seeing price momentum starting to weaken, we are actually making a lower low now, we were making lower highs, but now we have broken that particular trend, MACD also in a
bearish formation, still above the zero line, but the 12 AMAs below the 26 AMA, if it goes below the zero line there in purple, that's where you can see an acceleration of selling. So this one is, you got to kind of watch yourself getting back within the range, or that channel is first and foremost, but if we break below that, that's where you can see accelerated selling, and that's kind of what the trade's kind of looking at, or the technicals is turning to hone in on at least for the moment. Okay, and now to shift gears to our last name, that is Starbucks, Starbucks is actually higher by about six cents per percent today, and actually the strongest performer of the year, which many have varied, various opinions on this very costly turnaround, but what we do know is actually it's outperforming the overall market this year, so Dan, walk us through your thinking here for our final trade in Starbucks. Yeah, yeah, this one I have mixed opinions on, but I think if you look at the price action, now we are coming off of the intraday lows, where we did see it lower on the session, now how you're on the day, after the big sell off yesterday, and just the pressure of the last couple days. But again, you look at the EPS on this thing, it's still pretty lofty, and some
of the dynamics as far as the reports that have come out, certainly the turnaround looks like it's working, but at what cost? And are they able to able to meet the EPS estimates, even with the shifting dynamics that they're trying to undertake to streamline the business? So I mean, I think that they're still potential for further downside here as we do see a break of this most recent range. But again, I think there will be an opportunity to create, to pick up the stock if we do see some further weakness. So really today, I'm looking to maybe position for a little bit further downside, and if we see will break down to the recent lower end of the range, have the opportunity to get put into the stock by doing a buying a put one by two on the stock. So basically buying one near the money put and selling two other money puts with a range to capture the downside journey, but also having the opportunity to get put in the stock at a better level if we do seem further weakness over the next month. Yeah, and so I mean, as you think through that, I'm trading, of course, Starbucks here, and navigating the recent volatility and the fact that there's various diverging
opinions as you just light out. I mean, with the uncertainty and the geopolitical, and frankly, the international situation remaining relatively uncertain, I mean, trading this name here, how do you prepare for this uncertainty? Was that for me? Yes, sorry, Dan. Go ahead. I'm sorry, Jenny. Oh, yeah. Yeah. So, you know, the trading example today is again, to capture a potential breakdown. And I looked at the 90 strike in April, so buying the 190 put and selling two 85 puts, you can do that for about 20 cents. So it costs a little bit of money to put this on, but you do have a nice capture zone below the market right now. And if you trade below 85, then you get put in a stock near the low end of the range for the past year. So that's the thought process. I mean, you certainly could look at maybe the 95 90. It's a little more, it's more at the money, creates a little bit more of a zone to capture at near the money and still have the same dynamics as far as having the opportunity to get put in the stock at a better level. Okay, now KG, walk through the technicals here and what we're seeing with Starbucks. Yeah, this stock has been trading
like a utility company rather than something that provides a little bit of growth. And with that being said, we have now defined a key area of resistance as well as an area of support. The resistance level is sitting at around $100, $100 to $104 has been the cell zone for this name over the last year. And we have seen some buying activity below that $80 level. And this is a stock that also likes to trade in a little bit of a channel or a defined range, especially on a monthly basis. And right now we did see a break yesterday of a channel to the downside here. And what you're looking at is either the stock going to the 200 day moving average in red, which could act as an area of support, which was previously acting as an area of resistance. That's sitting in around $90. That could be a buy point here. And if not, you see a breakdown. You start looking at the $82 to $80 level as the next major area of support for this name. Now, I will say they do have a downgrade today and the stock did flush initially. But buyers are stepping in and it's actually green on the screen while the equity market is actually lower. And this looks like it's developing a
pretty decent hammer candle here. So keep your eye out on this one. Let's see if we have some follow through. If not, if we do the 50 period moving average, which is going to be $95.65 going to be the next area of resistance, you do not like seeing the RSI breaking down. MACD also in a bearish formation leaning more bearish than bullish here. But maybe we go back to retest that 200 day moving average and buyers try to step in on that. Okay, and appreciate it to you both Dan Deving Managing Partner at KKM Financial and Kevin Green. Thank you both for being here.
More episodes
More from Schwab Network

JNJ Balances Growth, Patent Transitions, and Legal Overhangs
Schwab Network

nCino (NCNO) CEO on Earnings, AI in Banking & Overcoming "SaaS-pocalypse"
Schwab Network

The Big 3: NET, TWLO, ASTS
Schwab Network

Tie Lasater on Inflation Floors, Energy Risk, and Private Credit Stress
Schwab Network