About this episode
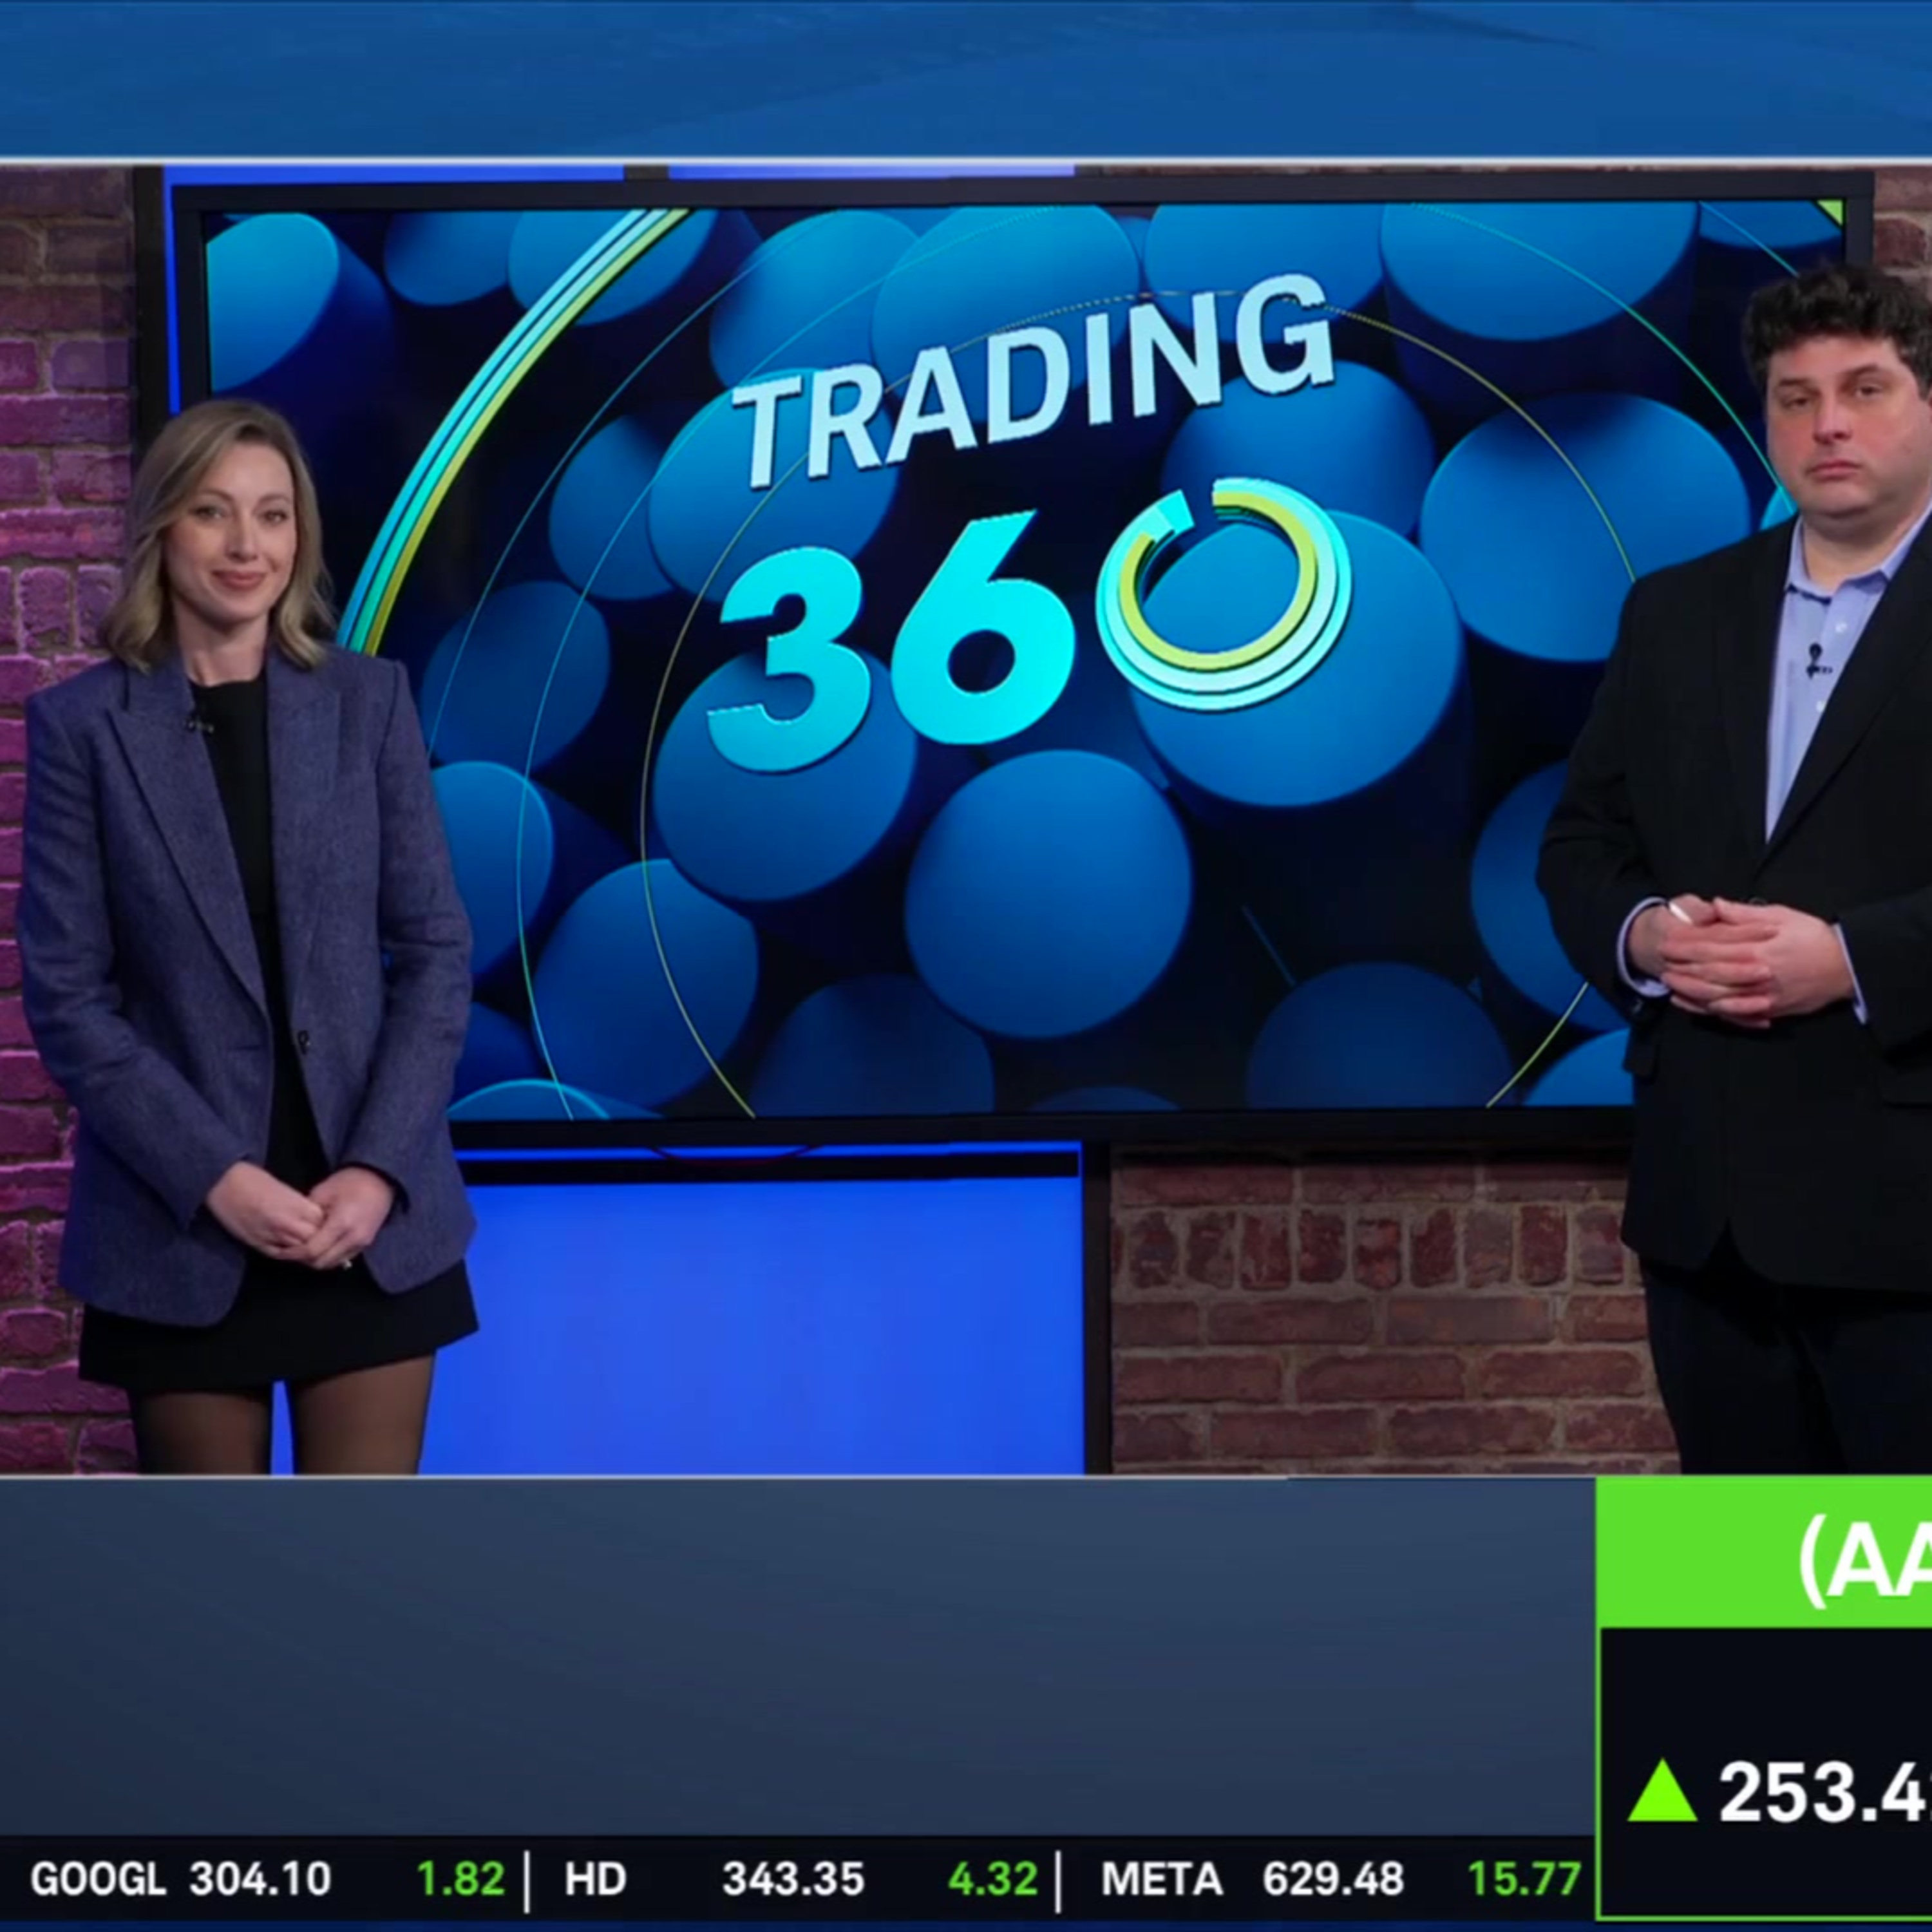
Jessica Inskip (@jessicainskip) is all about tech on today's Big 3. She sees Nvidia's (NVDA) GTC 2026 conference as a catalyst this week, IBM Corp. (IBM) holding enterprise software and blockchain opportunities, and Apple (AAPL) positioned to become a leader in consumer AI. Rick Ducat backs Jessica's analysis with a look at key levels in the stock charts.
======== Schwab Network ========
Empowering every investor and trader, every market day.
Subscribe to the Market Minute newsletter - https://schwabnetwork.com/subscribe
Download the iOS app - https://apps.apple.com/us/app/schwab-network/id1460719185
Download the Amazon Fire Tv App - https://www.amazon.com/TD-Ameritrade-Network/dp/B07KRD76C7
Watch on Sling - https://watch.sling.com/1/asset/191928615bd8d47686f94682aefaa007/watch
Watch on Vizio - https://www.vizio.com/en/watchfreeplus-explore
Watch on DistroTV - https://www.distro.tv/live/schwab-network/
Follow us on X – / schwabnetwork
Follow us on Facebook – / schwabnetwork
Follow us on LinkedIn - / schwab-network
About Schwab Network - https://schwabnetwork.com/about
Interactive timestamps
Jump to segmentGet every episode summarized
Each time Schwab Network publishes, we email you a written briefing from the transcript — the topics, who appeared, and any specific claims, with the ad reads skipped.
Email me new episodesFree for 3 shows. No card needed.
Transcript ready
223 searchable segments. Every word is indexed and playable.
Full transcript
Schwab Network — The Big 3: NVDA, IBM, AAPL. Machine-transcribed; use the interactive transcript above to jump the player to any line.
0:00All time now for the big three, three stocks, three charts and three trades. Rick Dukeett will take us through the charts and here to take us through the trades is the one and only Jessica Nskiff, director of investor research stockbrokerest.com. Jessica, it is so good to see you. I haven't talked to you on air in a while, but let's start out before you get into the names on your list today, the picks on your list. I want to get your big picture take on the market right now. Absolutely, Diane, it is so great to see you as well. We've got such a challenging market structure, but I do want to consider what's happening this week. We do have a big Fed week. So it's going to be interesting to see what Powell says. I think the presser is going to be of the utter most importance. Additionally, we've got GTC within video and then we also have this conflict with oil. So I did a lot of deep dives into oil and last time we had a big velocity. So as I'm sure Rick will attribute to something moving too far too fast is worth of note. So there is a velocity of oil moving higher. And the last time we had this was in 2022, but we were in a completely different environment.
1:01At that time, we had a Fed that was trying to tackle inflation, moving into a restrictive environment. So anything that would tackle the demand side actually supported the Fed. Now we're on the other end of that spectrum where we're hoping that the Fed is not pushing us into a recession. We're assessing the balance of risks and I do personally feel it might be tilted a little more towards the employment picture, which means oil has of the most utter most importance because if it's tackling that demand aspect as it did in 2022, that could warrant actually more rate cuts, which the market is not pricing in. I don't think we'll see that this week, but it's going to be interesting to see how Powell digest that. And that's really what I'm watching. You know what else is happening this week? A big week for Nvidia, the first ticker on your list. So we've got GTC kicking off today. Nvidia obviously on a year-to-year basis looks much better this, so far this year it's been pretty range bound. But tell us about your thesis on this one. Yeah, Nvidia has been range bound, but Jensen Wong has such a way with words and I think
2:04his keynote is going to really set apart what we're seeing. And the demand that we've seen so far from all of the hyperscalers and the software companies that have reported Oracle even told us demand. So I think he's going to set the tone and we're moving more from this layering aspect into inference, introducing LPUs even in addition. So it's going to be interesting to see what he introduces, but what is true is the demand story is there. The demand story we have seen from the other companies, we've also seen that translate into real revenue. So why I'm choosing Nvidia today to really discuss is it's a great buying opportunity. We could sell cash secured puts to get into it if something is range bound. I love to implement something called the wheel strategy where we sell the cash secured put in order to enter the security and then sell a covered call when it's stuck in a range on those levels and I'm sure Ricker will absolutely point out. So I think the key moment within video this week is just understanding not necessarily demand story because we know that, but what is the next big thing?
3:05What does that inference look like? How are we going to increase that mode and how is Nvidia going to do that beyond solely GPUs? Okay, Rick, let's get into it and take us through what we should pay attention to on this chart. Right. So in video, you know, it seems like it's an interesting day for some of the conductors micron showing some particular strength here, but when we look here at our chart for Nvidia specifically, we can see this triangular type shape here, two trend lines converging toward each other, expressing a increasingly narrowing range of activity here. So that can be kind of counterintuitive because it may feel boring in the short term, but low volatility can often be the precursor to high volatility when you do start to get some kind of breakout activity. So in the shorter term, one of our boundaries might be this trend line here near about 185 to 187 roughly and then down here are lower and would come in right around 175 here to look at some horizontal levels, 170 to 165 here represented an important series of low
4:08points that we saw earlier in this year after our very sharp rally to the upside. We had a brief period of flattening out, and then we additionally found support there a couple more times, didn't quite test it right there, but came close. So to the upside, 195, that's kind of the top of our range that we've seen recently saved for this upside excursion that took us just shy of 213. So when we do look at our moving averages that we follow here, pretty much sideways clustered together right on top of each other, we find our five day, 21 day and 63 day exponential moving averages representing week, month and quarter. So all together right around 183 to 184, meanwhile, 251 day and orange are yearly down here near 168 RSI matching up with our price activity on the verge of a breakout potentially to the upside here from not only its trend line, but also the 50 midline. So that would be kind of an interesting development here. Some profile is very kind of pronounced here.
5:09You can see that very much of the trading activity has taken place in this range, which kind of makes sense. That's where we spent most of our time this year, but the most active level, 181, 63 is our point of control. If we were to start to drift too far below 175, the next pocket of activity is around 155 to 160. All right, let's get into the next ticker on your list. You've got IBM, Big Blue in your sites, Jessica. Listen, this one has had a rough year so far this year with that really coming last month on worries about AI disruption fears. Take us through your thesis on this one now. So IBM has been one of my breakout stocks for quite some time, Diane, and that's for really a plethora of reasons. So I do think the software, SASS, Pockelips was very, very overstated, and there's certainly many use cases for still utilizing software and data is king. What's important with IBM is mainframe and the deep integration that it has, not only with brokerage firms, but large enterprise solutions, and that consulting arm, which was
6:10the fear of really the software stocks and what led to the sell-off, is IBM strengths. They are already in the room when they're making decisions, thus they are deeply integrated and more likely to have those longer term sales with those bigger corporations. So in regards to my top pick for an AI enterprise solution, it is IBM. On top of that, IBM has solutions and exposure to tokenization. This is a big theme that we're seeing. I know we've talked about this Diane, where we're going to take the AI rally and we're going to rebrand it to the efficiency rally, and I believe IBM is a big component of that. So stabilization and tokenization, having solutions for that as we see the big banks doing that and legislation pushing through the system as we get more clarity on the clarity act pun completely intended, nonetheless the third component there as the exposure to the possibility of quantum, that that could be really something that could be a potential earnings catalyst. So there is a lot working for IBM. They are not against other AI models.
7:12They actually partner with all of them. So any introduction that we see of of cloud and and thropic and chat GBT and similar actually helps IBM because they're not in competition, they're in partnership. Okay, I love a good pun, whether it's intended or unintended, all right Rick, take us through the chart, right? There you go. Rick, what's the chart look like to you? Right. So this one, we have kind of a different situation from our last chart. In this case, we had a sideways pronounced range bound area, pretty obviously right here, between 288 or so to 320 took us up to our highs just short of 325. You can see as well if we were to backtrack, these were notable price levels in the past as well. You can see we often stopped and started there. However, we've had a big breakdown now. Our low point that we reached a few weeks ago here a couple months ago rather came in right around 221. If we were to backtrack once more, the tariff news shock event low, our worst clothes right
8:12about at that same point here. So that's why we try to keep track of some of these extreme closes. They can often come back into focus down the road. Now though, upward channel has been broken short term downtrend in our with our white trend line. There is still in play. Our recent low comes in near 245. So that would be a very short term breakdown point to watch out for now a much different picture for our moving averages here. In this case, we are quite close to our five day dark blue weekly EMA near 248. Our teal monthly comes in at 254. So that would be one place to watch for short term support as well. We are below our 50 midline on the RSI trending upward, making higher lows here. But we also haven't really taken out that high that we saw recently around the 50 midline. Finally, volume profile. In this case, we are near the lower end here, much of our trading activity between about 237 to 250, but just above a much smaller pocket in terms of its width here, but the intensity was greater. 258, our point of control, the heavy trading area, the bulls of want to break through.
9:16All right, Jessica, stop me if you heard this one before. Vestors have taken a bite out of Apple so far this year. Obviously, the picture is different on a year or a year basis, but where do we go from here? Diane, that's a good one. I like that, though. They're taking a bite out of Apple. So this caught my radar for multiple reasons, ones I've discussed with Marley, and I have it with you, Diane. This my top pick of the year is actually Apple from a consumer AI perspective. Now, the reason why I want to bring it up today is when today we've launched the AirPods Max 2, which we'll see how consumers take that on. But the new influx of the MacBook Neo, as we are facing all of these headwinds that are coming with AI, which is storage, driving up the cost of personal computers to the consumer. Apple's done the impossible and has introduced the Apple Neo MacBook, which is around $600. I personally visited Best Buy over the weekend, and that's the first thing they pointed me to. But what I thought was so interesting and what caught my attention is you can pull something on TikTok called Creator Search and Sites, I have access to that as a creator.
10:18There was over 7.7 million searches in a matter of three days, purely just for that MacBook. That was MacBook Neo. Then there was another over 4 million for another search regarding the new MacBooks. And then if you look online for reviews, those are over 7 million, so that tells me that there is demand. That's the way that those algorithms work. Like we're looking at charts. We're looking for an area of demand where buyers are putting a bid in and are overcoming that area of supply. I think if we could apply the same metrics as we would with TikTok algorithms or social media, we can see a same underlying theme. So if I see this underlying theme that there is a huge demand, or at least interest in the MacBook Neo, looking at early sales data, it's 2x. That's going to translate into earnings. And on top of that, when we had the open claw or moltbot, it's changed its name so many times. A lot of consumers were buying MacBook menus just to purely run that because of the compliance constraints or security concerns, which all translates into positive revenue for Apple.
11:19So I really think that this is a consumer cycle. They're finally going to give us the AI solutions that we're looking for. But right now they're going to give us the products line up so they can mesh together and do the beautiful things that Apple is known for. All right, Rick, let's get into it. You heard the thesis there. What's the chart look like? Yes, a wider range bound activity, I guess would be the theme once again here. In this case, though, I think you could argue that down here, 235 was where we had our breakout point. We repeated sealing here and then I pushed to the upside. Then our low came in here near about 246. So that would be the next low point. The traders might have their eye on if this decline continues here. Our downward sloping white trend line is in play after a downside breakout from our blue trend line here that was traveling upward across the lows. From there though, we did still make lower highs, successively here from our peak of 288.62 for now, though, kind of struggling still to retake this level here near 255, marking
12:23an old gap and a breakdown point that was also tested as support several times. So our moving averages in this case here, trending downward here prices slipping below them. The slopes have changed from upward to downward here, 255 is our 5-day EMA to the upside. That's our closest one. But down here, 251-day EMA presents a notable supportive area near about 247. So look for a bounce there potentially here and for RSI to improve as well along with price. If you do get matching breakouts for momentum and price, it's a better recipe than just having price breakout on its own. So now we can see here volume is heaviest here around 253-260 near our current activity. But we are on the verge of slipping lower here. The next node to the downside, roughly around 235-240 or so. All right. Thank you, Rick. That is Rick DuCat, our lead market technician and Jessica Innskip, director of investor research stockbrokers.com joining us in our studio in Chicago.
13:25Appreciate it, guys.
More episodes
More from Schwab Network

JNJ Balances Growth, Patent Transitions, and Legal Overhangs
Schwab Network

nCino (NCNO) CEO on Earnings, AI in Banking & Overcoming "SaaS-pocalypse"
Schwab Network

The Big 3: NET, TWLO, ASTS
Schwab Network

Tie Lasater on Inflation Floors, Energy Risk, and Private Credit Stress
Schwab Network