About this episode
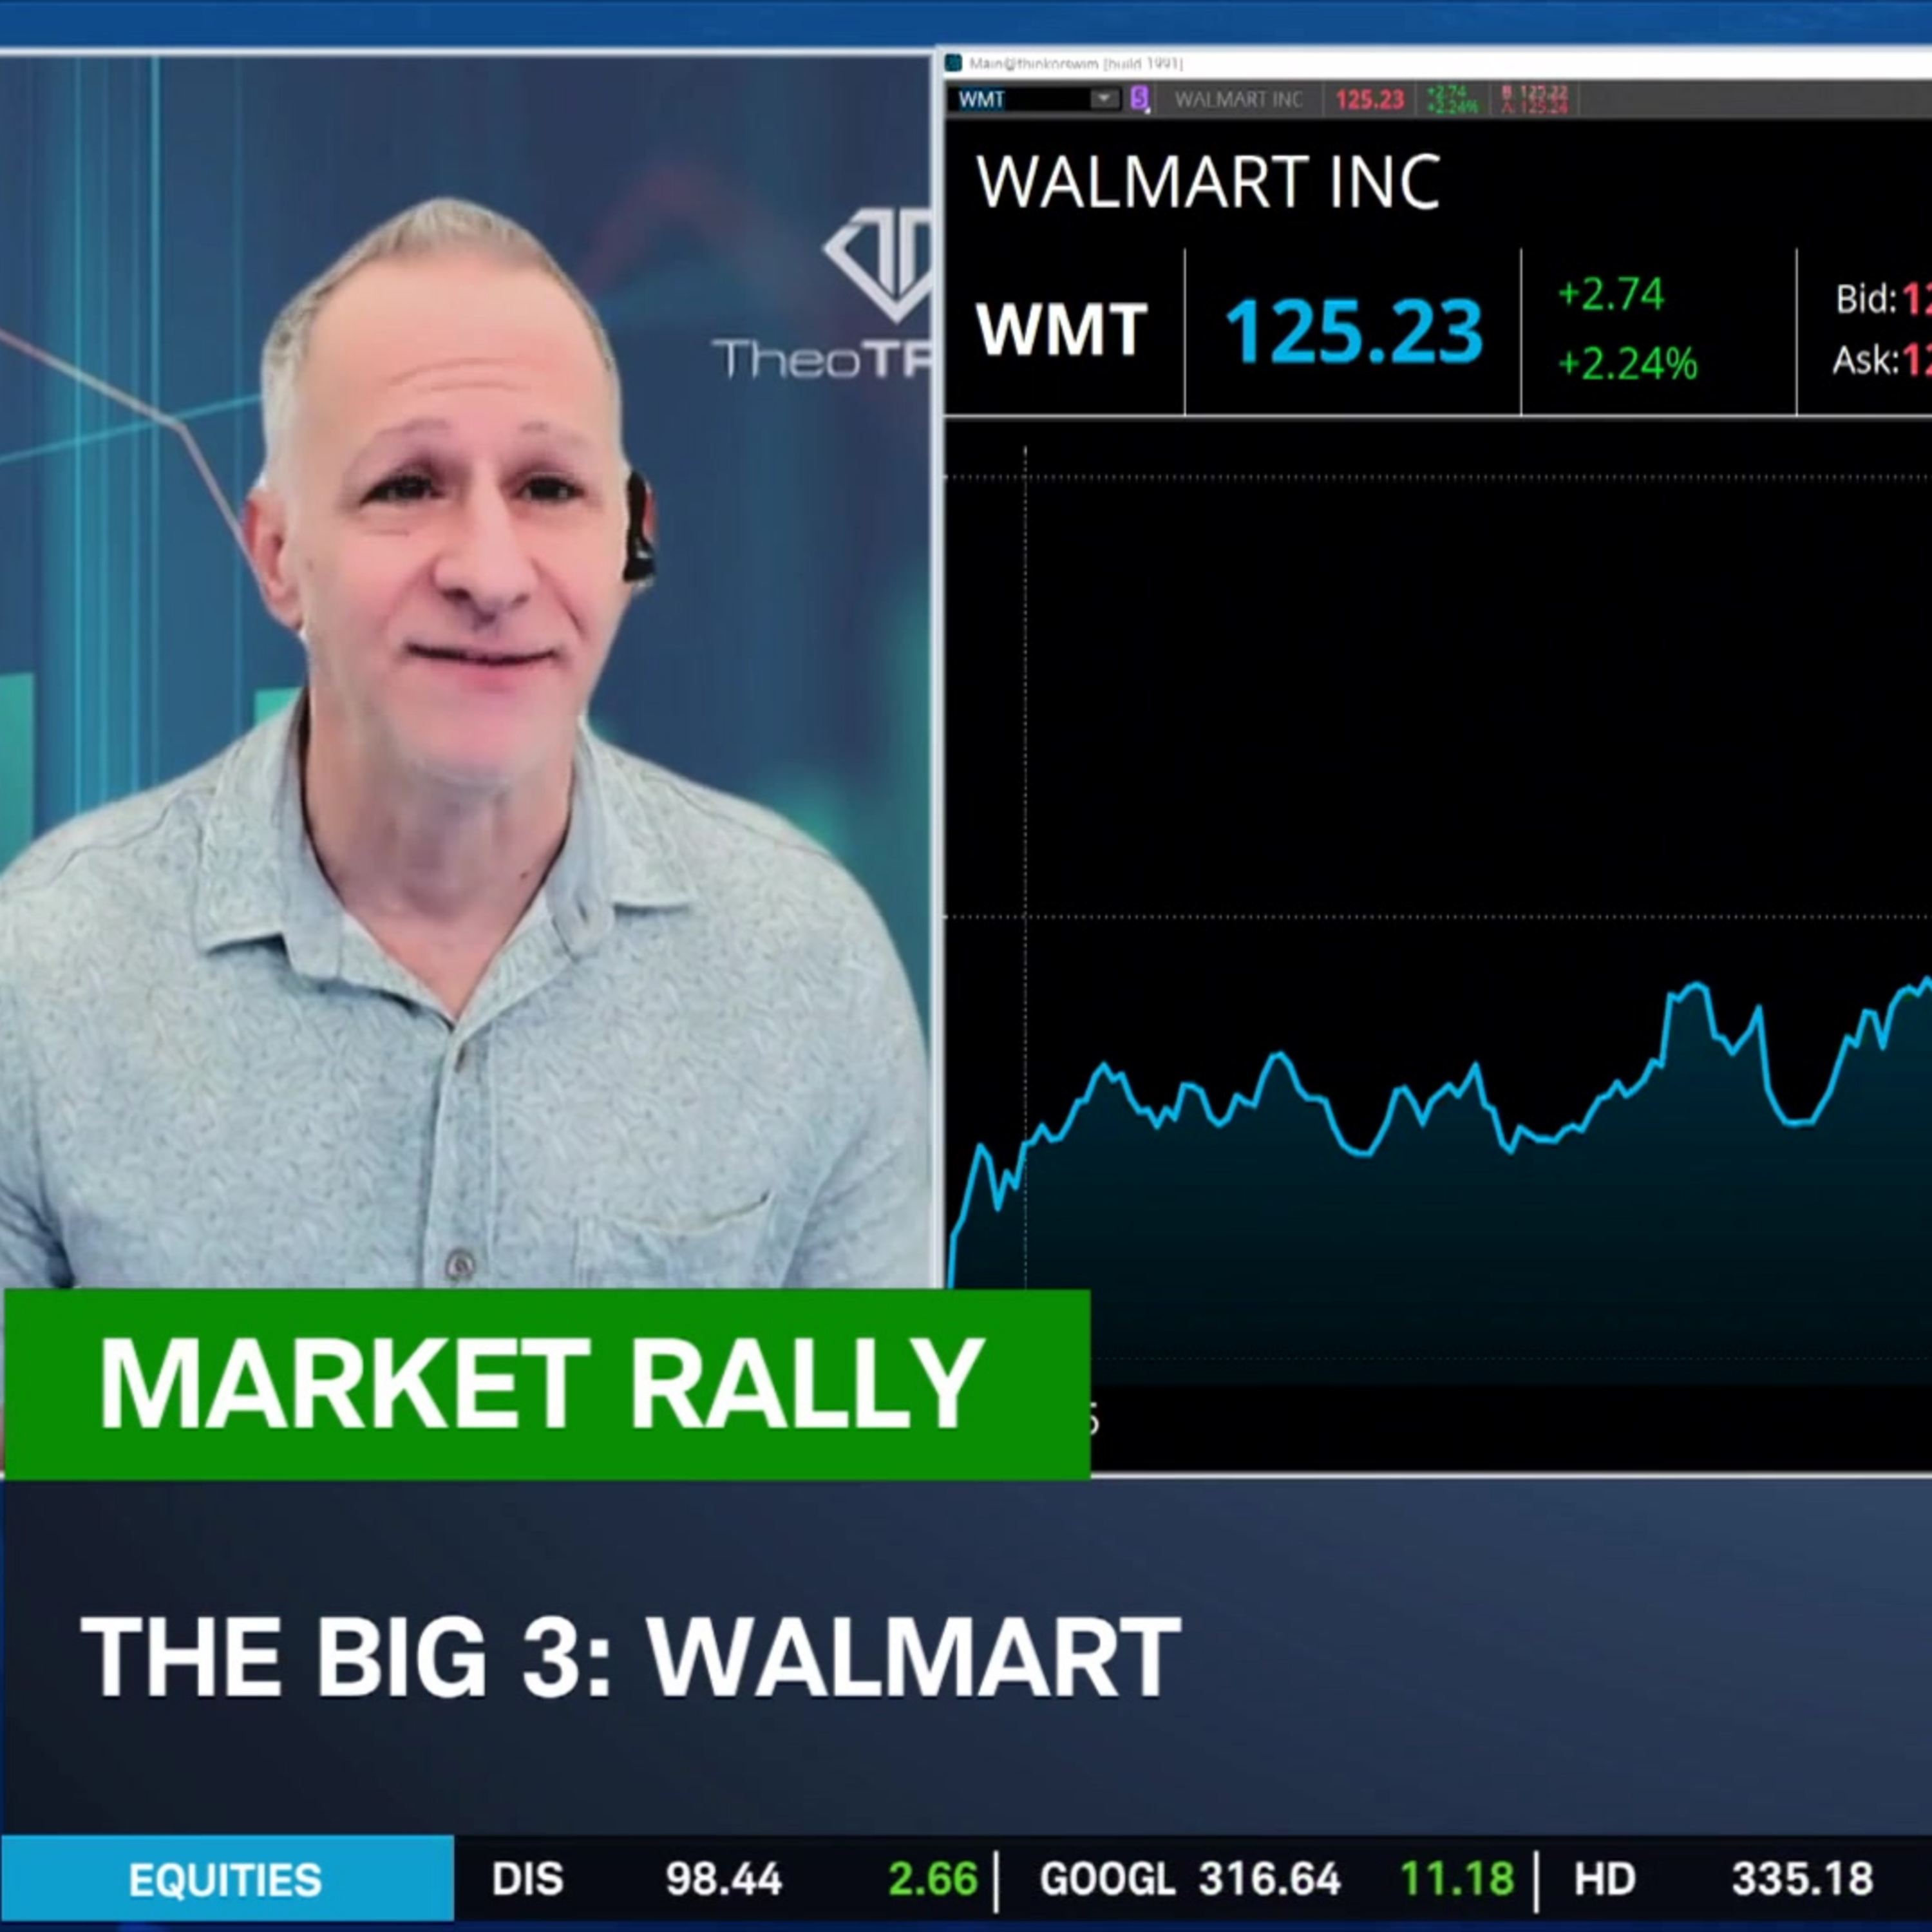
AI chips, retails giants, and legacy motorcycles take Don Kaufman's focus amid a sharp rally on headlines of a U.S.-Iran ceasefire. He sees Harley Davidson (HOG) shares hitting the gas in the near-future, Walmart (WMT) capturing more bearish interest, and Marvell (MRVL) continuing its recent uptrend as retail trade accelerates. Don backs his Big 3 with example options trades while Rick Ducat offers technical analysis in the stock charts.
======== Schwab Network ========
Empowering every investor and trader, every market day.
Options involve risks and are not suitable for all investors. Before trading, read the Options Disclosure Document. http://bit.ly/2v9tH6D
Subscribe to the Market Minute newsletter - https://schwabnetwork.com/subscribe
Download the iOS app - https://apps.apple.com/us/app/schwab-network/id1460719185
Download the Amazon Fire Tv App - https://www.amazon.com/TD-Ameritrade-Network/dp/B07KRD76C7
Watch on Sling - https://watch.sling.com/1/asset/191928615bd8d47686f94682aefaa007/watch
Watch on Vizio - https://www.vizio.com/en/watchfreeplus-explore
Watch on DistroTV - https://www.distro.tv/live/schwab-network/
Follow us on X – https://twitter.com/schwabnetwork
Follow us on Facebook – https://www.facebook.com/schwabnetwork
Follow us on LinkedIn - https://www.linkedin.com/company/schwab-network/
About Schwab Network - https://schwabnetwork.com/about
Interactive timestamps
Jump to segmentGet every episode summarized
Each time Schwab Network publishes, we email you a written briefing from the transcript — the topics, who appeared, and any specific claims, with the ad reads skipped.
Email me new episodesFree for 3 shows. No card needed.
Transcript ready
243 searchable segments. Every word is indexed and playable.
Full transcript
Schwab Network — The Big 3: HOG, WMT, MRVL. Machine-transcribed; use the interactive transcript above to jump the player to any line.
0:00I'm Jenny Horn and it's time for the big three, three stocks, three charts and three trades. Rick DuCat will take us through the charts and here to take us through the trades is Don Kaufman, co-founder of Theo Trade. Great to see you both start off this Wednesday, Don. Let's start with really your big picture of thoughts as we assess right now this very clear market rally. We're having a rally of course today, state the obvious here, but there's nothing going on that was not, you know, well foreseen. Like I think a lot of people are probably looking at the current move and going, this is an unprecedented move to the upside, you know, in the SPX specifically. So the SPX is of course the options marketplace S&P 500. It was pricing in this week, a $168 move and to my estimation right now we're literally $168 higher on the week right now. So net net, where are we right now precisely what the marketplace was anticipating the risk to effectively be? So the S&P's handicap, this forward risk extraordinarily well.
1:02Yeah, no, it absolutely is. And so now to dive into your first trade, which is Harley Davidson, we know this name has already had a pretty strong run. So risk and reward could be a bit more fragile from here, but what technical signals and what really momentum are you looking at that could signal that perhaps some of this strength could be losing steam? Yeah, so I'm much more of a quantitative trader. I'm going to be less into the technicals. I'm going to leave some of that to Rick, but to point out, I do believe that the risk reward right now is tilted right back down to the to the downside that most of this run, if you if you look at some of the technicals, which we will hear momentarily, most of this run has actually played out. But Harley Davidson has actually exceeded its expectations of movement in the last couple of weeks back to back on a statistical, you know, point of view. I'm looking for a pullback. This is nothing like outright bearish. It's just looking for kind of a minor pullback. And in order to be able to trade that where I think that there's effective risk reward, and that risk reward right now is favored to the downside, nothing crazy, just a little
2:03bit of a pullback. I'm actually going to go ahead and use a kind of shallow in time, okay, put spread. And when I say shallow in time, I'm going to go out to the April 24th options expiration. I'm just going to buy the 22 puts and sell the 20 puts against them. So it's just a $2 wide put spread done for a 75 cent debit. And this is again, it's just a defined risk spread looking for kind of a quick pullback here, where you have 75 cents at risk. Your upside is about a buck 25 again with favorable conditions, a nice little pullback here. Seize degrees of profitability. Okay, I like that. Just, you know, perhaps utilizing some of the strength for some perhaps a recent, at least near term weakness. If we do see that play out, obviously today, overall markets higher, Harley Davidson's higher as well. But as we do assess now, the technicals here, Rick, walk us through, I mean, the recent bounce has dawned at point out in, I mean, the trend that we've seen overall, because I will say, until this recent momentum, we have seen a bit of a pretty substantial pullback. Yes.
3:03So the first thing I would notice here is we did have this kind of W shaped price activity that gave us this double bottom here around the $17 level here. We did make a worse close after our first one here. But in terms of the intraday price levels, we mostly hung on around the same level. Now we've seen a bounce back to the upside here. So some horizontal price levels that stood out to me are roughly around 1950. That's where we saw some lows, subsequent highs, and then that's our breakout point then from there. And then around here, 23, 35 or so, 23, or excuse me, 21, 35 or 21, 40 roughly here. That was where we had our highs after a breakdown. And then the level here, 21, 80 roughly, a low point here, another notable low point there. So we are closing in on some of these old boundaries that we have established so far already. Our downward sloping, longer term, blue trend line has been broken. We have a shorter term, upward trend line in place here. It's quite steep though.
4:04The steeper the trend line, the less sustainable it is typically here. So, you know, not saying we're in for a collapse or anything like that, just saying we've had a rather lengthy, rarely off significant lows, and we're approaching resistance at this point. So, now, if we were to look at our moving averages, we have crossed above our three shorter term moving averages here, our most one that is most relevant to our current activity, five day weekly EMA in dark blue, comes in near 20, 90. It also lines up with our trend line. Beyond that, we have our quarterly 63 day EMA in gold lining up with the $20 price level so that could be another area to watch. Meanwhile, RSI showing a push into the overbought area that threshold above 70, typically regards a sign of strength in trending markets here, but it's a nuanced indicator here. You know, you couple that with the fact that we've already seen a rather lengthy push to the upside and we're approaching resistance. It means a bit more of a question mark on that entry into the overbought area here. So, now, if we were to look at our volume profile study, we can see that we have managed
5:08to make our way above our point of control that comes in right near 21. Things start to thin out a little bit here. Then we have another small node near about 2250 or so. Then another pocket of heavier trading activity up here between about 23 to 25 roughly to the downside. We can see that kind of matching up with some of these lows. The 18 level stands out as a point of heavy trading activity. Okay. Now to shift gears into our next name, which is Walmart. Walmart has acted like more of a defensive hedge, of course, with the stock a bit more stretched now. Don, how do you think through this trade given that the downside risk could, of course, be building? Yes. So, here I'm actually first and foremost, I'm going to go further out in time and I'm actually going to give you some fundamental reasoning. Okay. Defensive sector, it is. Consumer staples is where we've seen a lot of fund managers kind of pile into because, of course, of some of the geopolitical tensions. So, if you're a trader and or investor and you believe that some of the geopolitical risk
6:09is in kind of the rear view mirror, you've got to start asking yourself, is trade going to start to pile out of something like Walmart right now? This is, again, it's less in the technical sense, but when you start looking at like year to date, some of the consumer staples, and I look at it often to the consumer staples like ETF, it's up on the year. It's actually outperforming even technology in most respects. And at this point in time, again, if you're thinking geopolitical risks are going to obey it, Walmart, okay, this could actually be right now in the crosshairs, if you will, for a bearish trader. And that's exactly the way that I'm actually going to trade it. So, I'm going to take Walmart, I'm going to go out to the May 15th Options Exploration and May 15th Options Exploration, plenty of time over here. I'm going to be buying the 120 puts and selling the 115 puts against it. So, I love spreads. This spread is done for around $1.30 debit, and I love spreads because it's defining my risk. And it's also mitigating any volatility exposure in a market like this where you got one day where the S and P's are down and 100 the next day, they're up, you know, 140.
7:13This is a kind of trade that you want to take. It's a very hands-off approach with a $1.30 at risk. Let fly. If we start to see trade pile out of the consumer staples, this is Winner, Winner, Chicken, Dinner. Okay, I like that. We're chicken dinner and also Winner of at least today's session with everything higher up, a one and a half percent, and so Rick, as far as this technical set up, very different than what we just discussed with Harley Davidson, of course, but also I've seen a bit of a pullback, of course, as staples do tend to perform, again, just more tied to the overall market, but also more defensive in nature. Yes, we hit those highs shortly before our last earnings event, $134.69. From there, we had a pullback, as you all said. We could have drawn a downward sloping channel type shape between our two blue lines here. Now it seems to be in jeopardy of being broken to the upside, potentially here. We haven't managed across above our red line here near $1.27. That represents our previous highs, despite our push, attempted so far above this trendline
8:16here. So if we were to move higher, $1.29 also stands out as another relative high. But to talk more about that example trade specifically, $1.21 stood out to me, that was an old highs, lows around this area here, and that's around where we hit our low today. The 118 level here, another relative low, would be around where you would want this price activity to break if you were thinking about a trade such as that around 1870, was that break even or so. Then 116 stood out to me as a repeated stopping point for price. So those are some areas of note in terms of our horizontal price levels. Our moving average picture here shows one of a kind of indecision almost here. We have our moving averages that are getting clumped up together. They're all right around the 122 to 125 range here. Typically this speaks to lack of strong directionality. We can also see that we touched our opened up rather around our 63 day quarterly EMA. That's the longest term of our three moving averages that are nearby, so that would be the
9:18most significant if it were breached. Coming in right at the 122 level, RSI, managing to hold on above that 50 midline here, downtrend has been broken, uptrend still in play, but haven't really made relative highs above that previous peak that we saw a couple sessions ago here so far. Volume profile, now we can see that we had some relatively clear nodes we are within. The confines of this area here between about 123 to 129, after a short pocket of inactivity, we can also see about 117 to 121 is a noteworthy area here. So beyond that, 112 to 115 is another significant point for near term trading. Okay, last but not least is our big gainer of the session at least amongst these three that's Marvel, which is up now 4.3% seeing a pretty nice uptrend with momentum building and call buyers continuing to line up. And so Dawn, as far as assessing now how you think through trading this name, considering the fact that we are not yet at all time highs, but we did at least touch some recent highs
10:21today, given the continuation towards an uptrend here, walk us to your thinking. Yeah, this one, I'm going to change my tune, Jenny, I'm actually going to get bullish over here. It is a rare thing for me. I like to be the contrarian, but in this particular case, I think you just hit it right on. And that happens to be, it's got the momentum. It's also got a lot of retail trade in it. So I happen to look at the option, the option order flow in here and quite in depth. And really, what my trade is going to be based on, and it is going, of course, to be a bullish trade, but it's going to be based on is what I often term the gamma squeeze. And that's effectively, that's retail trade coming in there and buying calls like crazy. Then the market maker, of course, is selling the most calls. The market maker turns around buys the stock and we actually get caught in the cyclical rotation to the upside. And that's exactly, I think we're starting to see inside of Marvel, if and when Marvel starts to crack through and crack through 120 in a solid fashion, I think it really ignites from that point and goes right into all time highs. This one looks really bullish predominantly because of retail order flow.
11:23The trade I'm actually going to put on in here, though, has got some really big duration. I'm going all the way out to the June 18th. I don't mind. It's not really costing many more to do so. June 18th, and I'm going to buy the 125 calls and sell the 130 calls against it. That is uncharted territory, of course, for this underlying. So it's the 125, 130 spread for June 18th. This one's done for about $1.60 debit and all it really relies on is a set, you know, we're at or near highs, okay, you get above 120. The underlying ignites as traders actually rush in here to get inside of that gamma squeeze. Yeah, and I like that to end on the most optimistic of notes, at least amongst these three. And so Rick, as we watch the technicals here for Marvel, I mean, again, a name that's been able to somehow outperform the overall market quite well and has been continuing on its tear. So walk us through this chart. Yes, those types of runaway moves are what you try to look for potentially in technical trading here. Those outsize gains can really make a difference in your overall portfolio here.
12:25But now when we see here, we've seen some fluctuations today. We are remaining above our previous close here, a pretty strong day for semiconductors overall here. 114.92 is the high we've established so far. Our low came in around the 110 level. Some other notable pauses in terms of our lows during our very steep rally to the upside. 106 was a couple of lows that we saw there. The 100 level back here also represents roughly where we saw our best clothes for the year prior to our most recent breakout. There's also a round where we took a pause. That's also around where we seem to find some footing after our push to the upside. So the 100 level stands out in this case as well. Now we can see that our short-term 5-day EMA, our dark blue moving average near 108-58 here, lines up pretty close to our trunk line. The other moving averages have been kind of left in the dust at this point. One of the inherent difficulties of moving averages is their lagging indicators. It takes time for them to kind of catch up to the price activity.
13:27So even though they're not really super close right at this moment, you could try to keep an eye on our TL 21-day EMA currently around 97-54 could provide a supportive area. If we do start to see a pullback eventually, that could be viewed as a potential buying opportunity. That's how many traders use these moving averages as a support during uptrends, resistance during downtrends. Once again, crossing into the overbought area in this case, we are above that 70 threshold here, making new relative highs uptrend still in play. Finally, when we look at our volume profile study, there's a small pocket of activity right about here between about 105 to 109. That's about the best we can do in terms of a near-term foothold based on volume, a larger node comes in right here near around 98-99 or so. And then down here, the level between about 88 to 90 also stands out, much heavier activity down there. Okay, I appreciate it, Rick Ducat, for all of that technical breakdown, of course, the
14:28name that's up about 4% today being Amarabell and also appreciate Don Kaufman, co-founder of Theotrade, for all of the example trade setup.
More episodes
More from Schwab Network

JNJ Balances Growth, Patent Transitions, and Legal Overhangs
Schwab Network

nCino (NCNO) CEO on Earnings, AI in Banking & Overcoming "SaaS-pocalypse"
Schwab Network

The Big 3: NET, TWLO, ASTS
Schwab Network

Tie Lasater on Inflation Floors, Energy Risk, and Private Credit Stress
Schwab Network