About this episode
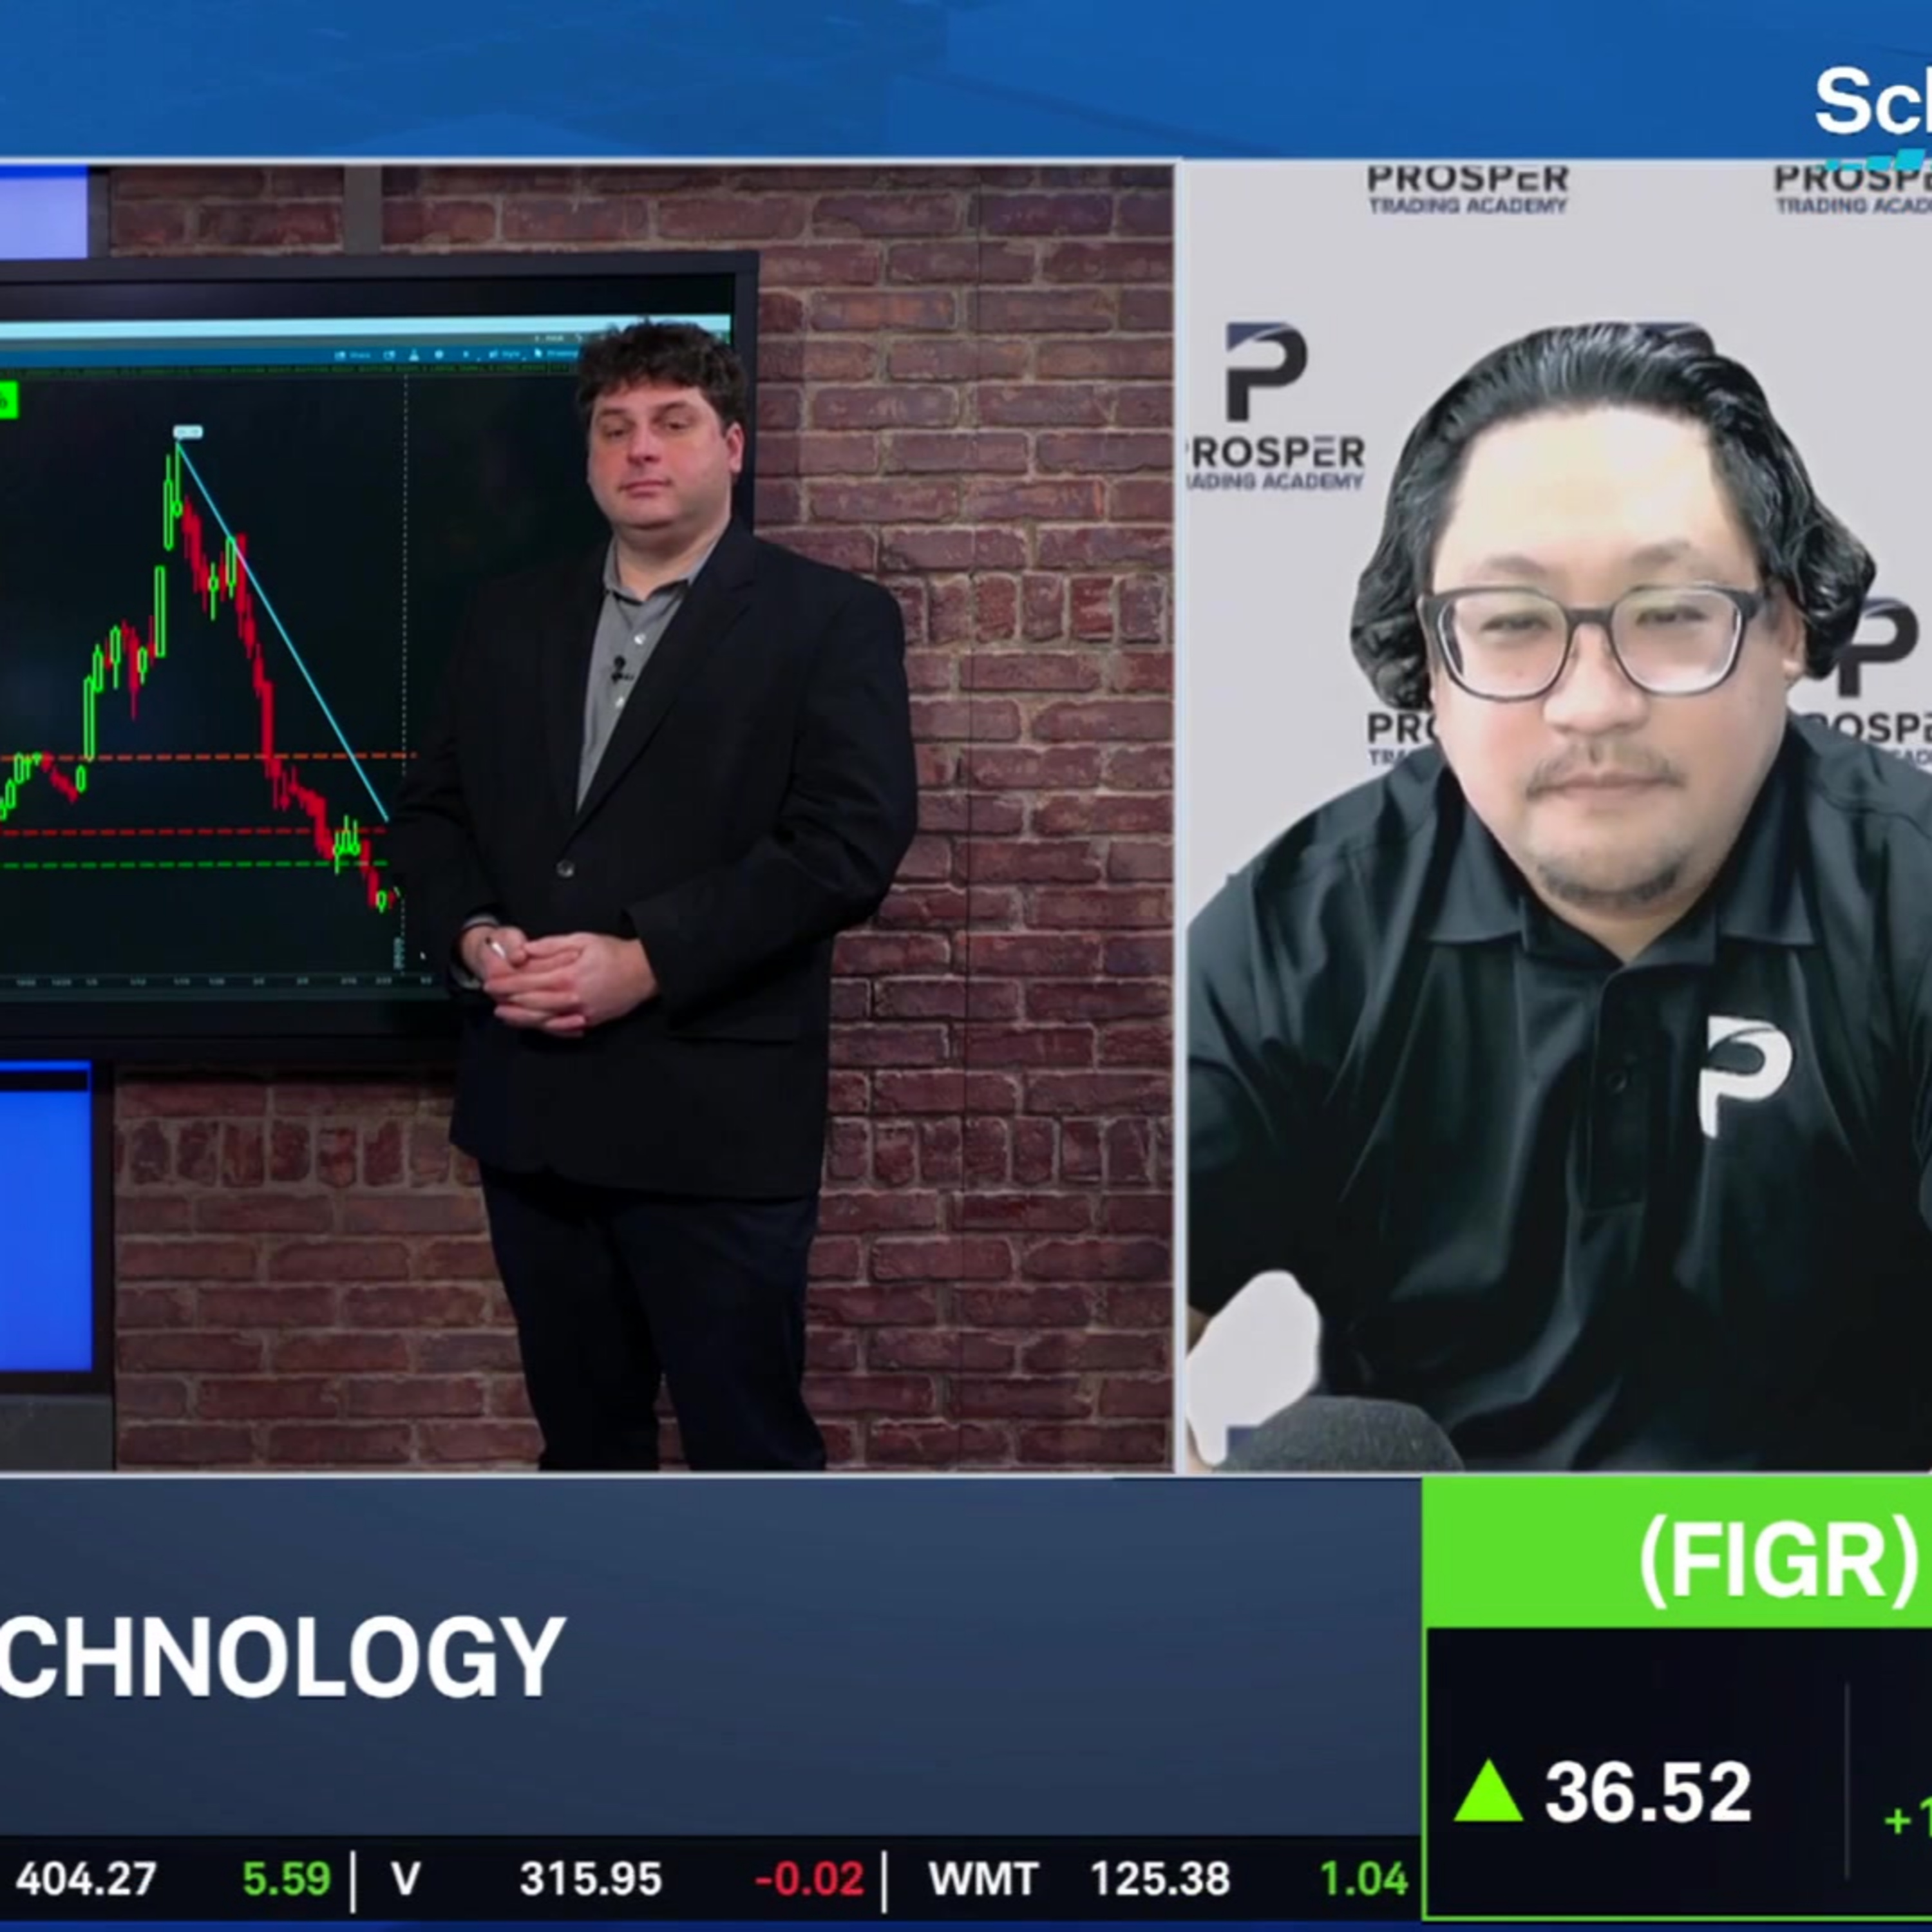
Volatility has tapered off throughout Tuesday's trading session, and Prosper Trading Academy's Charles Moon sees strong potential in corners of the market as the VIX ticks lower. He offers example options trades for Figure Technology (FIGR), Nextpower (NXT), and United Airlines (UAL). Rick Ducat adds color to the stock moves with a look into technical trends in the charts.
======== Schwab Network ========
Empowering every investor and trader, every market day.
Options involve risks and are not suitable for all investors. Before trading, read the Options Disclosure Document. http://bit.ly/2v9tH6D
Subscribe to the Market Minute newsletter - https://schwabnetwork.com/subscribe
Download the iOS app - https://apps.apple.com/us/app/schwab-network/id1460719185
Download the Amazon Fire Tv App - https://www.amazon.com/TD-Ameritrade-Network/dp/B07KRD76C7
Watch on Sling - https://watch.sling.com/1/asset/191928615bd8d47686f94682aefaa007/watch
Watch on Vizio - https://www.vizio.com/en/watchfreeplus-explore
Watch on DistroTV - https://www.distro.tv/live/schwab-network/
Follow us on X – https://twitter.com/schwabnetwork
Follow us on Facebook – https://www.facebook.com/schwabnetwork
Follow us on LinkedIn - https://www.linkedin.com/company/schwab-network/
About Schwab Network - https://schwabnetwork.com/about
Get every episode summarized
Each time Schwab Network publishes, we email you a written briefing from the transcript — the topics, who appeared, and any specific claims, with the ad reads skipped.
Email me new episodesFree for 3 shows. No card needed.
Transcript ready
333 searchable segments. Every word is indexed and playable.
Full transcript
Schwab Network — The Big 3: FIGR, NXT, UAL. Machine-transcribed; use the interactive transcript above to jump the player to any line.
And it's time for the big three. We've got three stocks and three charts for you. Brick DeCat will take us through the charts here to take us through his picks today. Charles Moonstock, strategist at Prosper Trading Academy. Great to have you both with us. Charles would love to get your thoughts. You know, I'm looking over at the big board here. You know, we've got green pretty much across the board, very different picture than yesterday. We've seen a lot of movement in oil. You know, what are your thoughts on how the market is, is taking in this ongoing situation in Iran? I mean, it remains volatile. The situation remains volatile. And anytime we see commodities, especially when margins are raised, start acting, you know, wild or, you know, moving at historical levels. You know, we always had to be a little bit careful about what it's going to do to equities. You know, we talk about risk management with these firms and especially if they're trading with conviction that can lead to, you know, liquidation to hold on to certain positions. Especially if it goes against them, you know,
seeing this historic swing and crude, you know, this so far hasn't had any ramifications with the markets. For me, equities right now is pretty dialed in with the US dollar. As the US dollar is softened, the markets have put risk on here. But, you know, this just remains an environment where traders have to react very swiftly. It's a news driven environment. And, you know, we just can't rest on our laurels here. We can't trust the upside or the downside at this moment. And that's why you're seeing a lot of in and out trading, a lot of volume spiking, but not a lot of liquidity on the books. And that just, you know, that just is kind of the sign of the times right now. Yeah, it certainly complicates the picture. But as we look at your first pick here, figure technology, I don't know if you picked them before this move would happen this morning or after. So I'm curious here. But we're up about 11 and a half percent in figure today. So I take us through this first pick. Yeah, you know, I really love, from a technical standpoint,
I love the breakout above these faster moving averages. This is a stock that's, you know, gotten really rolled off the highs. It's a sneaky play on crypto as well. A lot of these fintech names haven't done well and continue to struggle a bit. But this is one that's really stood out due to the, you know, kind of the strength in the near term. So I was watching this 35 level, breaking this level and closing above this level and sustaining is going to be important. Because if they do, I believe the upside near term is not only 40, but could shoot as high as 43. I also think that this kind of market environment is actually beneficial for crypto. We've seen when crude is weakened here in recent days, that strengthened in gold. And then of course, when crude has gotten strong, that is weakened gold. And again, that ties a lot with the margin requirements to trade both of these commodities. But, you know, it's almost as if Bitcoin is the, is the flight to relief asset here, where people are kind of parking their money and saying, man, you know, we used to wonder
about the volatility in Bitcoin. And now it's it's kind of being viewed as safe haven in comparison to the precious metals and crude. So I feel that this is going to be beneficial for a stock like FIGR again. They're showing a lot of strength. They've been able to maintain the gains regardless of the markets. And this is just getting into a really nice recovery play. The upside is really in the picture here. Yeah, and certainly an evolving narrative when it comes to crypto and any of these crypto tied companies and fin techs that are all related to the blockchain process. But with FIGR to hold that 35 level, we do have to maintain these double digit gains today, Rick. So as we look at the technicals here, I see a lot of volatility here and it'll walk us through what you're seeing. An interesting move to be sure today here because recently we bottomed out near 25 that was our low point sensor. This stock began trading here, 2501. But you can see if we backtrack a little bit, some of these horizontal levels really stand out. We had a very small gap here and then it was repeated low point right there
around 33, 50 roughly. And then we also had a repeated ceiling here. This was often where price hit a stopping point. This was where we had our huge breakout with this large green candle. And this was around where we were treated to this general area. So standing out is 45 going forward here to the upside. We also have this additional red line here, a notable low point, a repeated high point. That's about over stopping today near 37. So those would be some upside areas of interest for anyone looking to trade this name here. When we do look at some of our moving averages, I chose to use simple moving averages this time because we don't have that full year of data just yet here. So our 20 day SMA here in this olive color, we have risen above that 3260s where this one comes in. Meanwhile, our 50 day SMA comes in just below 46. So that's another notable technical level to keep an eye on going forward. RSI improving as well. We are out of the oversold area. Our downward sloping red trend line has been broken.
Green trend line in play, RSI making new relative highs along with a price here. And looking like it's on the verge of crossing above the 50 midline. So a bit of a more of a bullish read on momentum here for this name. Finally, our volume profile study shows that we are re entering the major trading zone here between about 35 to roughly 43 or so. Our point of control comes in around 35, 60 as well. Our heaviest trading area. Another pocket of volume down here near 30. If we can clear through this congestion area, there's another node up here from 53 to 58. All right, and right now figure trading at 3663. Again, now even moved higher since when we started talking there up more than 12% right now. So as we take a look at your next one, we're going to change spaces here. We're going to move into next power. Also moving higher on the day. We're up more than 4% already. So far this morning, what made you put this one in the big three today, Charles? This has been one of those unheralded names
that have just been a complete riser over the last year. And I always look for relative strength at levels of importance, psychological levels, previous levels of resistance. And that's pretty much what happened. They topped out at 130 that came screaming down to the $100 price. And for there, for about a week and a half, buyers and sellers were kind of duking it out. But the buyers were really responsive. We saw some pretty sharp buying coming in near the $100 price. They're finally starting to break free. And what's really happening is that they're hiring through some key technical resistance levels. So they're at one dynamic price levels, at one 13 price. I believe that you get above this level. This is a pretty easy shot all the way back up to around 125, 127. They have the ability to move without much obstruction, meaning technical obstruction. And whenever we see these stocks kind of hit these profit pockets, they have that ability to really retrace back to those levels very, very quickly.
So again, in a market environment where we're looking for swifter moves, more media gratification type plays, this fits the profile. If it is able to get above 113 in anchor, I really love the upside to run 125 to 127 in the near term. All right, Rick. So as you look at the technicals here, are you seeing the potential momentum to get us up to that 125, 127? You know, it's certainly possible. And the 113 level is the very price that I also had my eye on here. The reason why is because it was the bottom of this repeated range that we saw and its corresponding ceiling around 123, 124 around that general area here. So very, very notable range bound activity here. We did have a breakdown that filled this gap. However, we did stabilize around the 100 level roughly here. Some notable lows that I saw, 96 was a repeated low point here. Then we had a high and then subsequent low after the breakout near 102. This general area also coincides with our trend line
going across these lows. This is a round where price seems to have found some footing. Now, the resurgence has happened, but we've paused at this resistance level once more. We also have a corresponding downward sloping trend line here that you could also use in your analysis here. So that would represent a breakout above 115 or so to clear that level. So if we were to look at our moving averages, we've switched back to our exponential moving averages for this chart here. Now we can see that price has kind of rapidly taken out. Three of our shorter term ones, five day in dark blue, 21 day in teal, 63 day in gold. So our teal, 21 day monthly EMA is the closest sitting right around 110 or so. So look for that as a potential short term supportive levels. Notice as well that the RSI, which was showing us some declines here, we struggled to maintain our footing above that overbought area. Now we are crossing above the 50 midline and crossing above our downward sloping trend line. So momentum to answer the initial question here,
momentum does seem to be improving and starting to favor the bulls. Finally, our volume profile study here, we have the advantage of seeing some very clear nodes in this case here. So very clearly defined trading activity areas between 85 to 92, 97 to about 103 or so, 104. And then here, 116 to 122. So those are the pockets of heavy activity where you might expect a potential congestion. All right, right now next power trading at about 112, 83, this morning that is up about 4%, a little bit more than 4% right now. Your last pick though, United Airlines. We've started talking about travel and airlines quite a bit, pretty battered over the last month down more than 20% on discussions of rising fuel costs. They had some bad weather that came in to play here, restricted travel with the situation in the Middle East. Take us through this United Airlines and where you see it going. Yeah, in my opinion, they're already showing signs of slowing down.
They basically had a quadruple top at the 52-week high. So they just couldn't get past this one 19 price. But as long as this Middle East conflict remains, I think the airlines are just a huge fade. So every time they're rallying, I'm looking for an opportunity to short these stocks. So right now I'm watching this 98 level, which is the 200A moving average. The downside targeted immediately is going to be 85, could be as low as 73. Just a few years ago, there was a standard in the industry where the airlines would pre-purchase fuel at a specific cost and they would be locked in. Well, United Airlines, American Airlines, and Delta has deviated from that. And so now they're exposed to the rising and the rapid rising costs of fuel. And this is going to obviously have a heavy negative on their margins. And you know, you couple that with obviously displace flights, cancel flights. You know, this just doesn't spell well fundamentally for these airlines.
So, you know, while I've seen United spike off these lows, again, you know, I believe it's going to be brief. I believe the trend is going to be working lower and it really wouldn't surprise me to see UAL training in the mid to lower 70s by the end of this month. All right, Rick. So in the 70s is a level that's been highlighted. I do see that pretty severe downward channel that you've drawn there. You know, what's the technical outlook here? Yes, a very steep decline here. I believe a fuel cost is like 21% of United's expenses last year. So this is a big deal for companies like this. So when we do look at our horizontal levels, again, we see frequent stopping points where price matches up. We can see this was a notable high point. We had a gap to the upside. That was our low point. That's around where we had our worst clothes then. That's around where we stabilized yesterday. So around 85, just above that 89. You can see a similar type of activity around there. That's also where we opened up yesterday. To the upside then, 95 and 100 standout for highs
and another gap level, 100 would be another gap being filled here. So those would be some of our price levels that stand out. Our moving average is not the greatest picture here. We have fallen below all four of them here. Most notably, our long-term 251-day EMA in Orange that comes in near 96. So that would be an upside resistance point traders may want to watch out for. RSI continuing to worsen as well. Downward sloping red trend line on the verge of crossing below the 30 threshold, which would represent a move into the oversold area. Kind of counterintuitive to the name, a push into the oversold area and a downward trending market. Usually as viewed more as a sign of further weakness to come. So keep an eye on that indicator as well. Finally, our volume areas that stand out. Here to here, 90 to 95 kind of feels like our last stand here before this gulf of trading activity. Not really a whole lot to break our fall until we start getting around 75, 80 or so. Point of control stands out near 78. All right, and then that 70s range is what Charles was
looking for the move to the downside. But right now, even down a percent and a half we're still up in the 90s, firmly at 93, a little north of 93 right now for United. Charles, wanna thank you for being with us for the big three today. Charles Boone's stock strategist at Prosper Trading Academy. And of course, Rick Ducater lead market technician for always breaking down the technicals for us.
More episodes
More from Schwab Network

JNJ Balances Growth, Patent Transitions, and Legal Overhangs
Schwab Network

nCino (NCNO) CEO on Earnings, AI in Banking & Overcoming "SaaS-pocalypse"
Schwab Network

The Big 3: NET, TWLO, ASTS
Schwab Network

Tie Lasater on Inflation Floors, Energy Risk, and Private Credit Stress
Schwab Network