About this episode
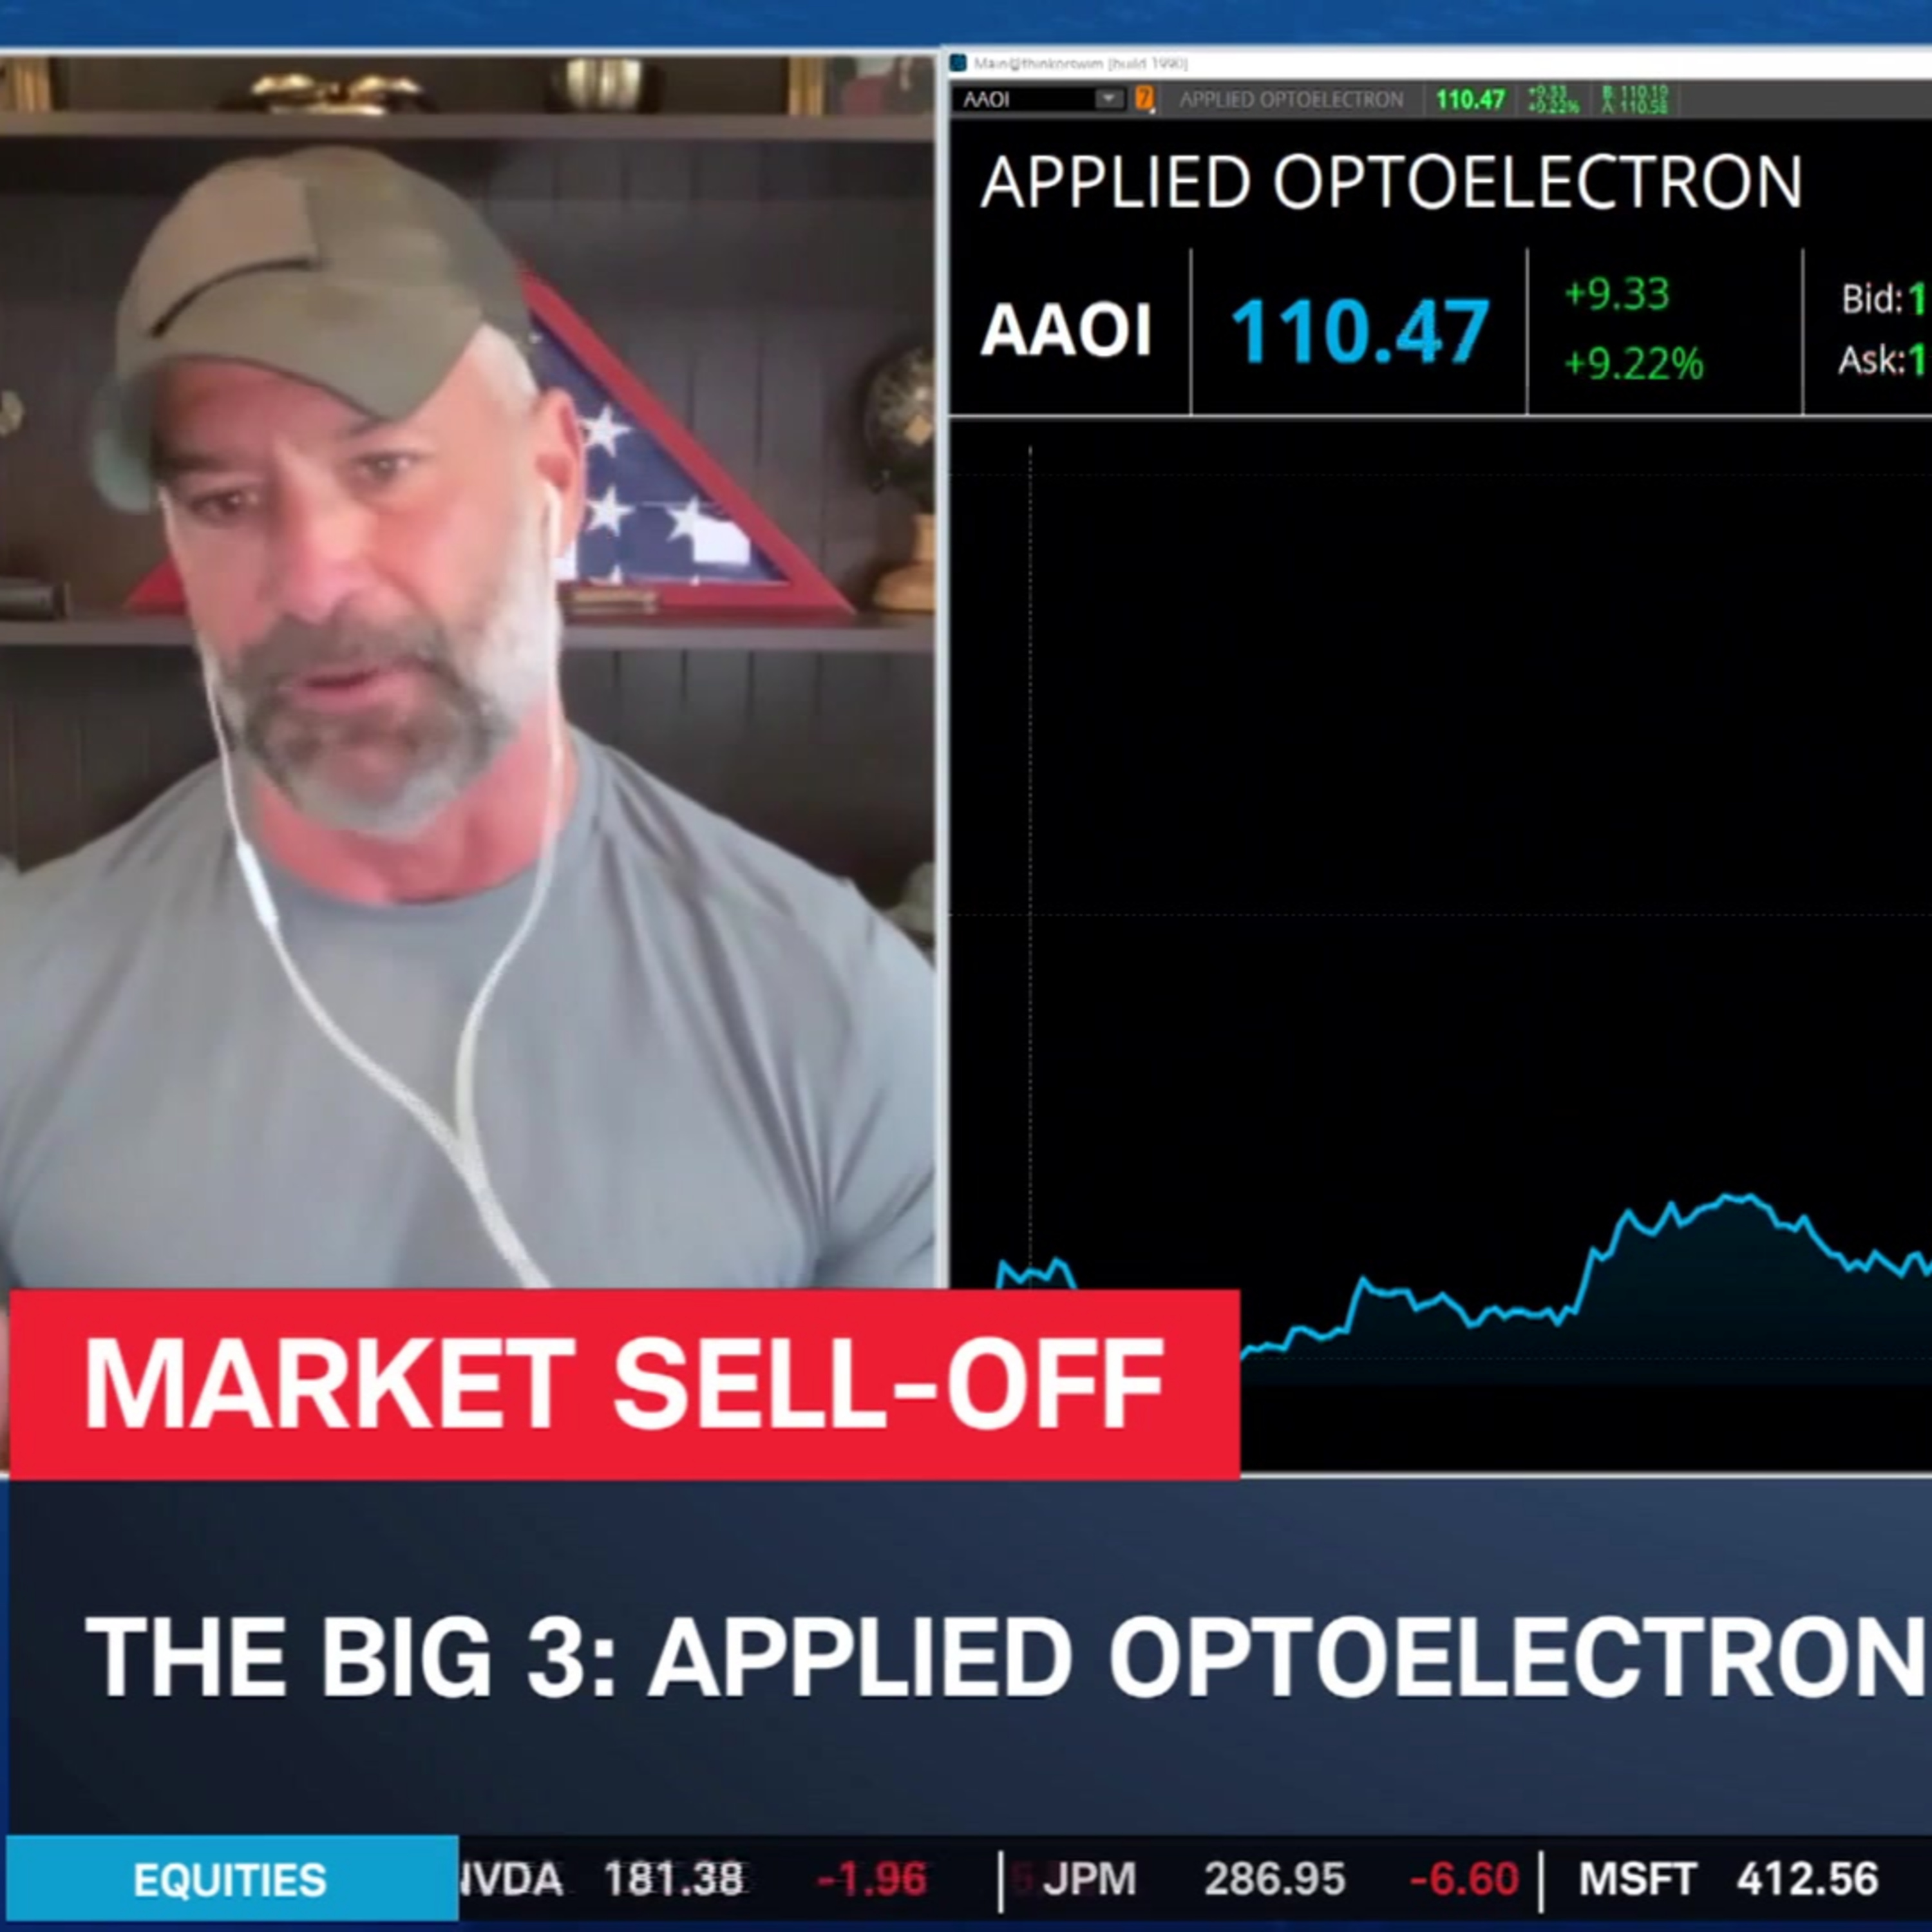
A bull-led rally is coming to markets once they can storm past geopolitical uncertainty, says StocksToTrade's Tim Bohen. Until then, he sees trading opportunities in Chevron (CVX), Applied Optoelectronics (AAOI), and Amazon (AMZN). Rick Ducat backs Tim's analysis with a glimpse into key levels to watch on each stock chart.
======== Schwab Network ========
Empowering every investor and trader, every market day.
Options involve risks and are not suitable for all investors. Before trading, read the Options Disclosure Document. http://bit.ly/2v9tH6D
Subscribe to the Market Minute newsletter - https://schwabnetwork.com/subscribe
Download the iOS app - https://apps.apple.com/us/app/schwab-network/id1460719185
Download the Amazon Fire Tv App - https://www.amazon.com/TD-Ameritrade-Network/dp/B07KRD76C7
Watch on Sling - https://watch.sling.com/1/asset/191928615bd8d47686f94682aefaa007/watch
Watch on Vizio - https://www.vizio.com/en/watchfreeplus-explore
Watch on DistroTV - https://www.distro.tv/live/schwab-network/
Follow us on X – https://twitter.com/schwabnetwork
Follow us on Facebook – https://www.facebook.com/schwabnetwork
Follow us on LinkedIn - https://www.linkedin.com/company/schwab-network/
About Schwab Network - https://schwabnetwork.com/about
Get every episode summarized
Each time Schwab Network publishes, we email you a written briefing from the transcript — the topics, who appeared, and any specific claims, with the ad reads skipped.
Email me new episodesFree for 3 shows. No card needed.
Transcript ready
299 searchable segments. Every word is indexed and playable.
Full transcript
Schwab Network — The Big 3: AMZN, AAOI, CVX. Machine-transcribed; use the interactive transcript above to jump the player to any line.
And it's time for the big three. We've got three stocks for you today. Three charts. Rick DuCat will take us through the charts here to take us through the trades. Tim Bowen, chief technical trainer at StocksToTrade.com. Tim, always great to have you with us on a Friday. We are looking at another sell-off on this Friday, though. We've got oil quickly approaching crude at $90. Dollars of barrel were at highs we haven't seen in two and a half years. What's a big picture thought on the action we've seen this week? Well, actually, I've watched the previous segment with Patrick and really agree with him in a lot of perspectives. I will add one piece in that, you know, a lot of what we do on the big three is we talk about technicals. And, you know, you look going back to October, November, that exact same period he referenced. I mean, we've just been in this kind of 6,700 to 6,900 range on the S&P and to me, it's pretty bullish when you consider the fact that it's just, I mean, I can't remember the last time
we had like good news market related. It just seems like every day you wake up and it's like, where's the bad news? Where's the bad news? Where's the bad news? And every time that happens, you know, the S&P pulls back to about that 6,700 level, which we're at right now, holds and then lifts above. So what makes me excited about that from a technical perspective is, at some point we got to start getting a little bit of positive news flow. It's spring, love is in the air, you know? Like, once that news flow turns a little bit, I think we're just set up for a big run into the summer. Now, that being said, right now, I mean, basically S&P looks like it's got one leg in the grave and another one on a banana peel. But if we could just get a little bit of positive news, I think we're set up for an amazing rest of the year. All right, just got to get off that banana peel before we slip here. But your first play likely tied to some of the conflict that we're watching unfold in the Middle East right now. We've got Chevron as pick one for the big three today.
You take us through your thesis here, Tim, and what's your outlook for Chevron? So this was, you know, that kind of idea that I share here and my swing trade AI, I know I talked about it a lot, but it picked this one up right after the Vennon's Waila situation, basically because they're one of the oil companies with the biggest exposure in Vennon's Waila. So since then, you know, since that raid by Delta Force, I got my Delta Force books over here. But since that raid just been on a grind and setting up, I think just to kind of continue this slow march higher. And it's kind of my favorite big name oil and gas stock. And, you know, as I say often, I'm the big three. It's like, if it does no wrong, you stay long and that's kind of the way I look at Chevron right now. All right, Rick. So as we look at the technicals for Chevron, obviously with some of the geopolitical risks that we've had this year and laid into last year, we've seen a lot of upward moves in these names here, like Chevron, you can see it here in the technicals. But what are the technicals showing us recently?
Yeah, it's certainly not a boring time in the world right now. And this can lead to instability and oil prices climbing here. And that's what we've been seeing lately here. So 192.41 was our intraday high that we reached today. So that would be the mark to beat to the upside. For now, though, we're on pace for a marginally lower close, our recent relative low comes in at 184. Another notable low here at 179. We also have this low point that we saw when our gap upformed here that comes in around 171. So if we were to look at our moving averages, we can see that for now, there doesn't really seem to be a lot of strong signs that the trend is being interrupted here. Price remains above our relevant moving averages that we follow for now. It seemed like our low point was around our 5-day weekly EMA in dark blue, a breakdown through our channel type shape, could lead us to test our TL21-Day EMA, our monthly EMA, right around 184.
So just a bit below that. Now there is one sign of a potential trend slowdown here. And that is some bearish divergence on the RSI. The RSI also is no longer in the overbought area, which is typically a sign of strength. So what we're seeing is the pace of the gain starting to slow down somewhat. Not necessarily a guarantee that price is going to go down. But now we're seeing the point where things are perhaps getting a little bit more precarious. And what the bulls would want would be a big push above the old highs that we formed recently to continue the uptrend here. Meanwhile, what you might see during that time would be perhaps potentially a retreat back to a supportive level. In this case, according to our volume profile, the area between about 181 to 187 stands out for potential support, where we have our heavy trading node. Not really too terribly much until all the way down here, 165 to 168 is the next significant area from a volume perspective. All right, and right now with Chevron, surprisingly trading a little bit lower today,
despite this massive move we're seeing up in oil. But overall, as you highlighted, outperforming this year pretty considerably. This next name, though, trading much higher today, looking at applied optoelectronics here, up more than 9% so far this morning, Tim, why are you looking at applied optoe? So this was one had banger earnings back, I think it was the third day of Friday last week. And then I know I mentioned that swing trade AI. I put a trade on this on Monday. Our entry was right around 100. And the reason I brought it today was just all through the week. This thing is just held up like an absolute champ. When you look at all of the uncertainty as that bad news flow that I've talked about, but just as held up, held up. And I like it as a data center play. I mean, fiber optics and interconnects. We've got all these data centers coming online. People love to talk about the chips, but these servers got to be connected.
The data centers got to be connected to other data centers. So it's just kind of that picks and shovels AI play. And I will say this, like I did, I send these ideas over at 813 in the morning. I did not expect that extreme of a move on AI, but at 8 this morning, you know, was looking pretty solid and it's kind of following through. And really, I think there's a lot of potential upside on this guy as well. Yes, certainly hard to expect a 9% move in what looks like it's going to be a down trading day on a stock where I just checked these numbers. Because again, they almost look like a typo. You're to date up 214% for applied optoelectronics, which Rick, as we now turn to the technicals, you can see just this almost completely straight linear move to the upside. Yeah, and you know, to piggyback on what you're saying up over 1,000% from those lows in your 971. So really impressive runaway price activity here. This is where things get tricky now. Because if you are long, it's like you've kind of caught the tiger by the tail.
You have this runaway upside move, which is a good problem to have in many ways here. But now it's like, where does this stop? What's the sensible place to maybe think about that idea? So for now, 114.63 is our intraday high that we've reached so far. We have this gap as well here near about 85.86. I noticed that after we had our big push to the upside, we did not actually fill the gap. So kind of interestingly, that would be a bit of a sign of strength here. As Marley said, of almost vertical line to the upside here, the sharper and steeper a move, generally speaking, the less sustainable it is, that certainly doesn't mean there isn't still room to go to the upside. Just kind of keep in mind here that these things can have quick pullbacks and be kind of alarming with how quickly it can happen here. So now we can see that our blue 5-day EMA 98.65 lines up with our trend line here. So that's one possible point to look for a breakdown area. RSI showing some strength as well overbought.
We are seeing a tiny bit of divergence though, but we did have kind of this reset and price here where we retreated back to support. So just keep an eye on it, I would say, but it's less worrisome than the different situation where perhaps we are struggling to overtake a consistent resistance level on the RSI's waning. So just some food for thought. It's a very nuanced indicator. Now we can see as well another smaller volume node right here. 93 to 98. That's where we had our most trading activity here, not really too much to make sense of until all the way down here near 40. But look, very heavy volume as well suggests very high conviction on the part of traders. So this is a noteworthy thing that happens after you have that extreme move of people are willing to make plays on it still. All right, and with applied up to, I mean, you highlight just this incredible moves we've seen the last year, more than 600%, but your today really amazing performance there. Your last pick here is Amazon.
Take us through Amazon and where do you think it's going Tim? So this is that it's hard to not love Amazon, especially when you have the lovely Mrs. Bowen that has about six packages a day show up on my doorstep. But we had that big pullback on earnings there a few weeks ago, really kind of an extreme pullback, you know, not the kind of move you expect from an Amazon. And then the level that I've been waiting for basically hit a little earlier in the week, you know, pulled back, right in that kind of 205 to 10 area banged around there for pretty much all of February. And then finally broke out of that range. My thought is that that was an overreaction of the earnings, you know, just a lot of people were panicking, taking profits, et cetera. I think this has great odds of kind of filling that gap back to where it was pre-earnings. And then I know I'm kind of beating this positive newsflow, you know, if we can start getting a little bit more
frothing market, a little more excitement out there, maybe we can bust through to new 52 week highs. All right, Rick. So as we look at the technical setup for Amazon, does it look like we have the potential to maybe bust through to new 52 week highs? It's certainly possible. We did retreat to a prior area of importance here. You can see that we have a lot of horizontal lines here because there's kind of a lot of points to consider. This area really stands out to me, though, kind of this general region, 195 to 202, that's where we saw some noteworthy gaps, important lows and highs here. So that's around the same area where we solidified here, 202 especially was a frequent line in the stand for our price activity. From here, you could draw another upward channel type shape here in our very short term, taking our trend line going across these couple lows, really not a trend line, more of a boundary line, just trying to display the price movement, duplicate it, put it across the highs, matches up decently could be a way to gauge potential resistance here. Beyond that, though, 220 is around where we saw lows here repeated twice, around 220, 220, 1 or so.
That's around where we had our high recently as well. Then 227, same deal, two lows around where we had our highs and then our gap near 230, two. Beyond that, 248 would be the point where really things would be very interesting here because for a while, Amazon had this kind of compressing triangular type shape here. That would be the point where we start getting above some of those noteworthy elevated levels where price stalled out. So now, our moving averages that we follow, we can see things are starting to improve. We're starting to see closes above our shorter term moving averages, our blue five day, our 21 day teal. Both sit right around 214 on top of each other, so another noteworthy confluence point. Meanwhile, we have stopped short at our yearly 251 day EMA in orange near about 2.19. RSI improving though, downward sloping red trend line broken, upward sloping green trend line in play, just a hair below the 50 midline here, so look for a good solid close to the upside and for RSI to show a matching crossover
for further confirmation. Our volume profile study shows that we got stuck a little bit here at where the volume starts to pick up an intensity 220 to 233 roughly as our major big trading area, 221, 64, specifically our point of control, the heaviest trading area of all. If we were to move lower back here, 202 to 208 stands out as well as a notable pocket of a trading activity. Yeah, and right now, Amazon trading lower on the day, close to 2% at about 214, about 215 right now, actually dead even on 215, but trading underperforming the broader market this year, down about 7%. Tim, wanna thank you for being with us for big three for bringing those picks to us. So nice diverse options today. And also, Rick DeCat, our lead market technician for breaking down the technicals for us. Thanks to both of you.
More episodes
More from Schwab Network

JNJ Balances Growth, Patent Transitions, and Legal Overhangs
Schwab Network

nCino (NCNO) CEO on Earnings, AI in Banking & Overcoming "SaaS-pocalypse"
Schwab Network

The Big 3: NET, TWLO, ASTS
Schwab Network

Tie Lasater on Inflation Floors, Energy Risk, and Private Credit Stress
Schwab Network