About this episode
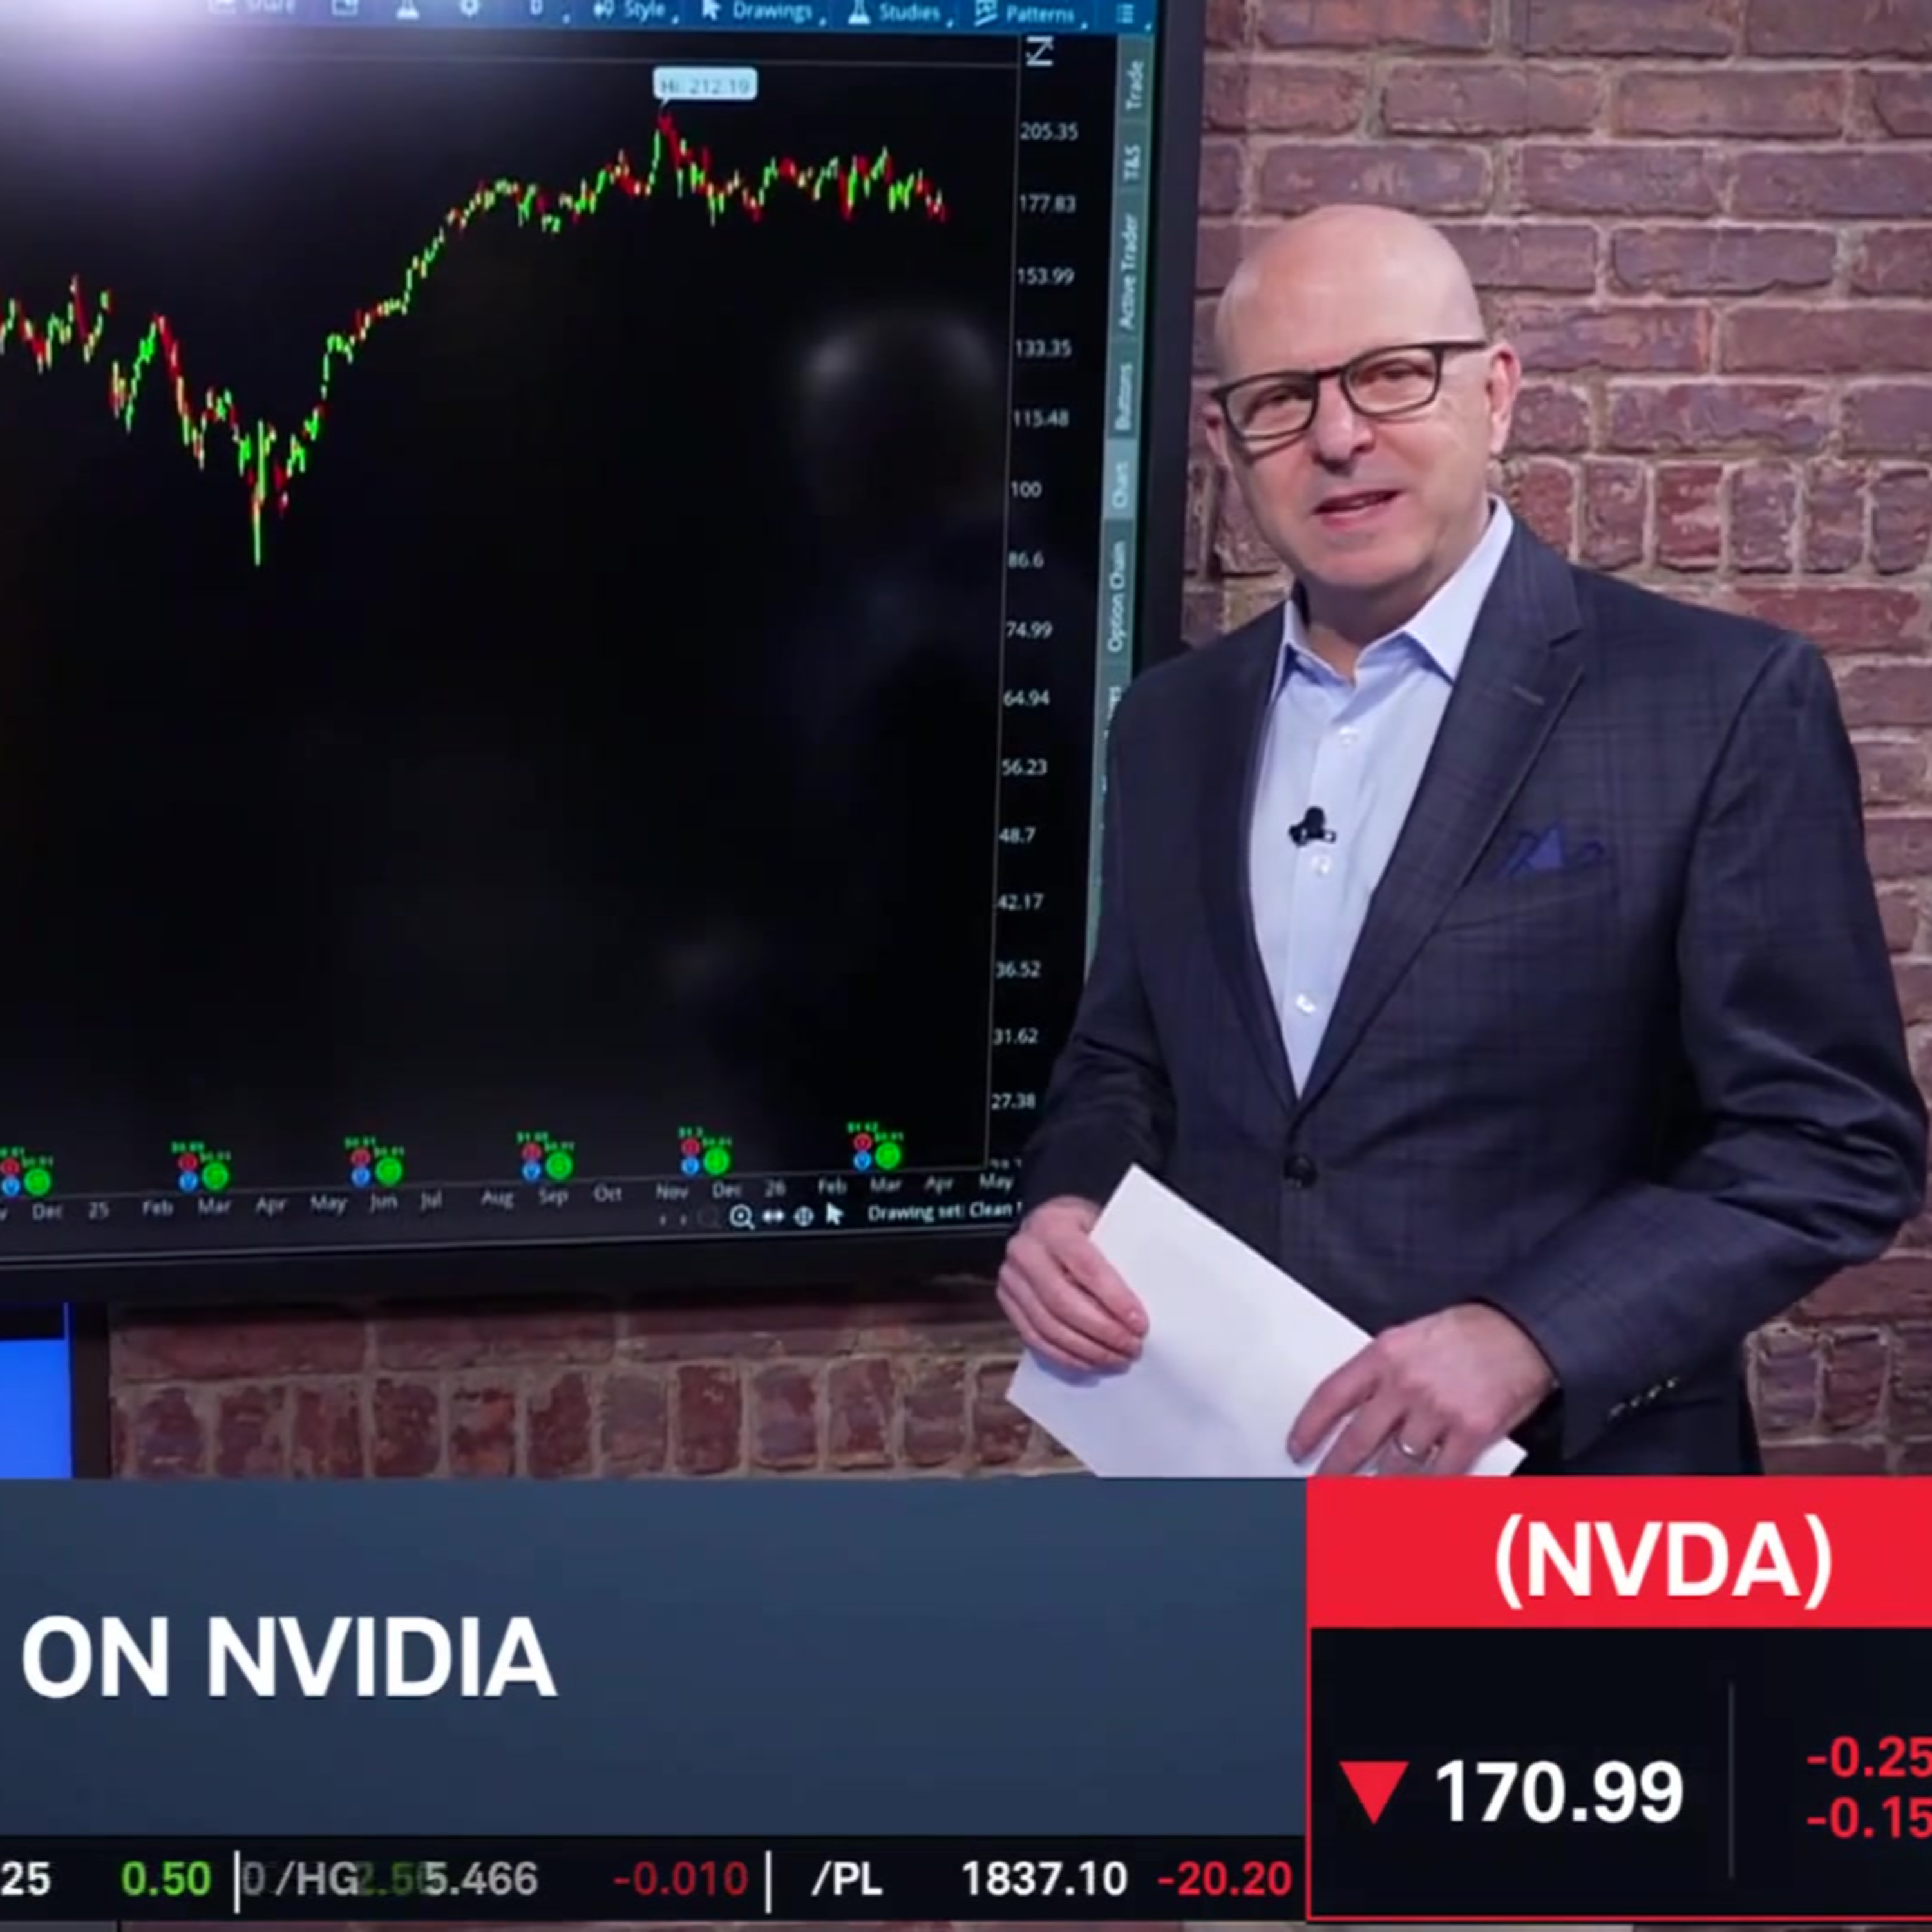
Nvidia (NVDA) is down 8% in 2026, but as Tom White points out, the stock is likely "settling into valuations" after a stunning three-year run. He then gives investors a closer look into the one-year chart and highlights key support and resistance levels. Tom later offers an example options trade for Nvidia.
======== Schwab Network ========
Empowering every investor and trader, every market day.
Subscribe to the Market Minute newsletter - https://schwabnetwork.com/subscribe
Download the iOS app - https://apps.apple.com/us/app/schwab-network/id1460719185
Download the Amazon Fire Tv App - https://www.amazon.com/TD-Ameritrade-Network/dp/B07KRD76C7
Watch on Sling - https://watch.sling.com/1/asset/191928615bd8d47686f94682aefaa007/watch
Watch on Vizio - https://www.vizio.com/en/watchfreeplus-explore
Watch on DistroTV - https://www.distro.tv/live/schwab-network/
Follow us on X – / schwabnetwork
Follow us on Facebook – / schwabnetwork
Follow us on LinkedIn - / schwab-network
About Schwab Network - https://schwabnetwork.com/about
Interactive timestamps
Jump to segmentGet every episode summarized
Each time Schwab Network publishes, we email you a written briefing from the transcript — the topics, who appeared, and any specific claims, with the ad reads skipped.
Email me new episodesFree for 3 shows. No card needed.
Transcript ready
44 searchable segments. Every word is indexed and playable.
Full transcript
Schwab Network — Options Corner: NVDA Slows After Stellar Multi-Year Run. Machine-transcribed; use the interactive transcript above to jump the player to any line.
0:00We're back on Morning Movers and video has traded range bound for several months with shares currently sitting at a key support level Recent earnings and announcements from the company's GTC just not enough to break it out of its range leaving investors looking for the next catalyst Now share some video are up 50% year over year but have fallen about 8% in 2026 Time now for options corner joining us to take a deeper look at the chart is Tom White co-host a fast market all right Tom What trends do you notice in this chart? Well, I wanted to kind of give you some context because everybody's been talking about this consolidation phase that Nvidia has gone through over the last six or seven months So I brought up a three year one day chart to kind of give you an idea of how well Nvidia shareholders have done over the last three years the stock was trading just around 25 26 bucks three years ago So we've rallied about 560 percent since that time with the stock sitting just about $171 at this point
1:04So this gives you a little broader view of what Nvidia has done maybe it's kind of settling into these valuations that it has Even though over the last six months we've seen valuations come in because growth the E part of their PE continues to grow at this point So this has been a head scratcher probably for the CEO for a lot of investors also but let's put it into context over a three year period as opposed to just maybe a six month period where we've seen this thing flat line a little bit in a tight range So I got another chart here that kind of gives you a little bit you know more clarity on a one year chart here one year one day I've got some simple moving averages to kind of take a look at here we've got the in the purple here we've got the 200 day simple moving average You know that's been an area of support over the last year but now we've finally broken through that level so you've got to take that into any assessment of what's been going on
2:05The 50 day moving average has flat lined as you can see here so we're now below both of those levels I think this is really key to kind of take a hold of because when the stock was hitting this level around the 170 price That's been an area of support over the last six months right this is a really key area but now for the first time the stock is below it's 200 day moving average While it approaches that 170 key support level so that's something for traders and investors to watch here and if you look at the volume profile here the 184 level has been an area of that consolidation That's been a heavy area of trading as far as volume goes we're now below that level by over $10 now where do you start looking to the downside for those first areas of support While you can start looking at the 158 157 level got a little volume node there but then all the way down here about 145 is going to be another key area of support if it does continue to fall here at this point
3:11So take that into context if you look at the momentum here we've got the RSI relative strength index about 38 level So not completely oversold anything below 30s oversold on a technical basis but if you look at the RSI over the last year any time we're down at those levels around the 38 below 40 level we start to see a rebound in the shares Will we get that this time I think that's one of the keys and then also if you look at the input to the overall market now in video stock has come in a little bit that means It's only about 7% of the S&P 500 that's still the biggest chunk of the S&P 500 and then the NASDAQ 100 it's actually over 13% of value in that index So you got to watch in video because it affects what's going on in the overall indices All right Tom and what's the approach you would take for an example trade well you know it's kind of it hasn't really been a falling knife
4:11You got to watch this 170 level as I mentioned that might be an area of support maybe we get a rebound or at least it just consolidates here above that level I think that's going to be what investors need to watch moving forward at least in the short term it's not immune to what's going on in the overall market also So I looked at a strategy that's neutral to bullish that gives you that opportunity to profit from these levels that we're at down here near support But then also it gives you that opportunity to potentially buy the shares at a lower price if the stock continues to fall So I looked at a cash secured put neutral to bullish here I went out to the April 17th monthly option So you got three weeks to expiration on this one relatively short term and this is one of those strategies you can be repetitive with You can continue to pick a price or a line in the sand and sell puts on it with the expectations that it remains above it If you just want to keep the credit or that you willing to buy the shares if it continues to fall But I went out to the April 17th monthly option sold the out of the money 165 strike put
5:13You're going to collect a credit if the stock opens up here about 171 of about $4.10 That's what your potential profitability could be $410 per put that you sell But what it does is it takes your break even where you start to lose money down to that break even of $160.90 That's about 6% below the current share price in video So I always talk about this as a twofold type of trade because it's capital intensive because you might have to buy the shares if the stock falls below 165 And you get a sign down that short put if you're still short that put Is you've got to be willing to buy the shares now you can put a bid in for $160 $161 and maybe never get filled if this stock doesn't fall to that level But it's capital intensive as I mentioned that's your break even you want it to remain above there if you just want to keep that credit of $410 that you collected All right, thank you Tom. This is my co-host of fast market catch Tom later this afternoon
More episodes
More from Schwab Network

JNJ Balances Growth, Patent Transitions, and Legal Overhangs
Schwab Network

nCino (NCNO) CEO on Earnings, AI in Banking & Overcoming "SaaS-pocalypse"
Schwab Network

The Big 3: NET, TWLO, ASTS
Schwab Network

Tie Lasater on Inflation Floors, Energy Risk, and Private Credit Stress
Schwab Network