About this episode
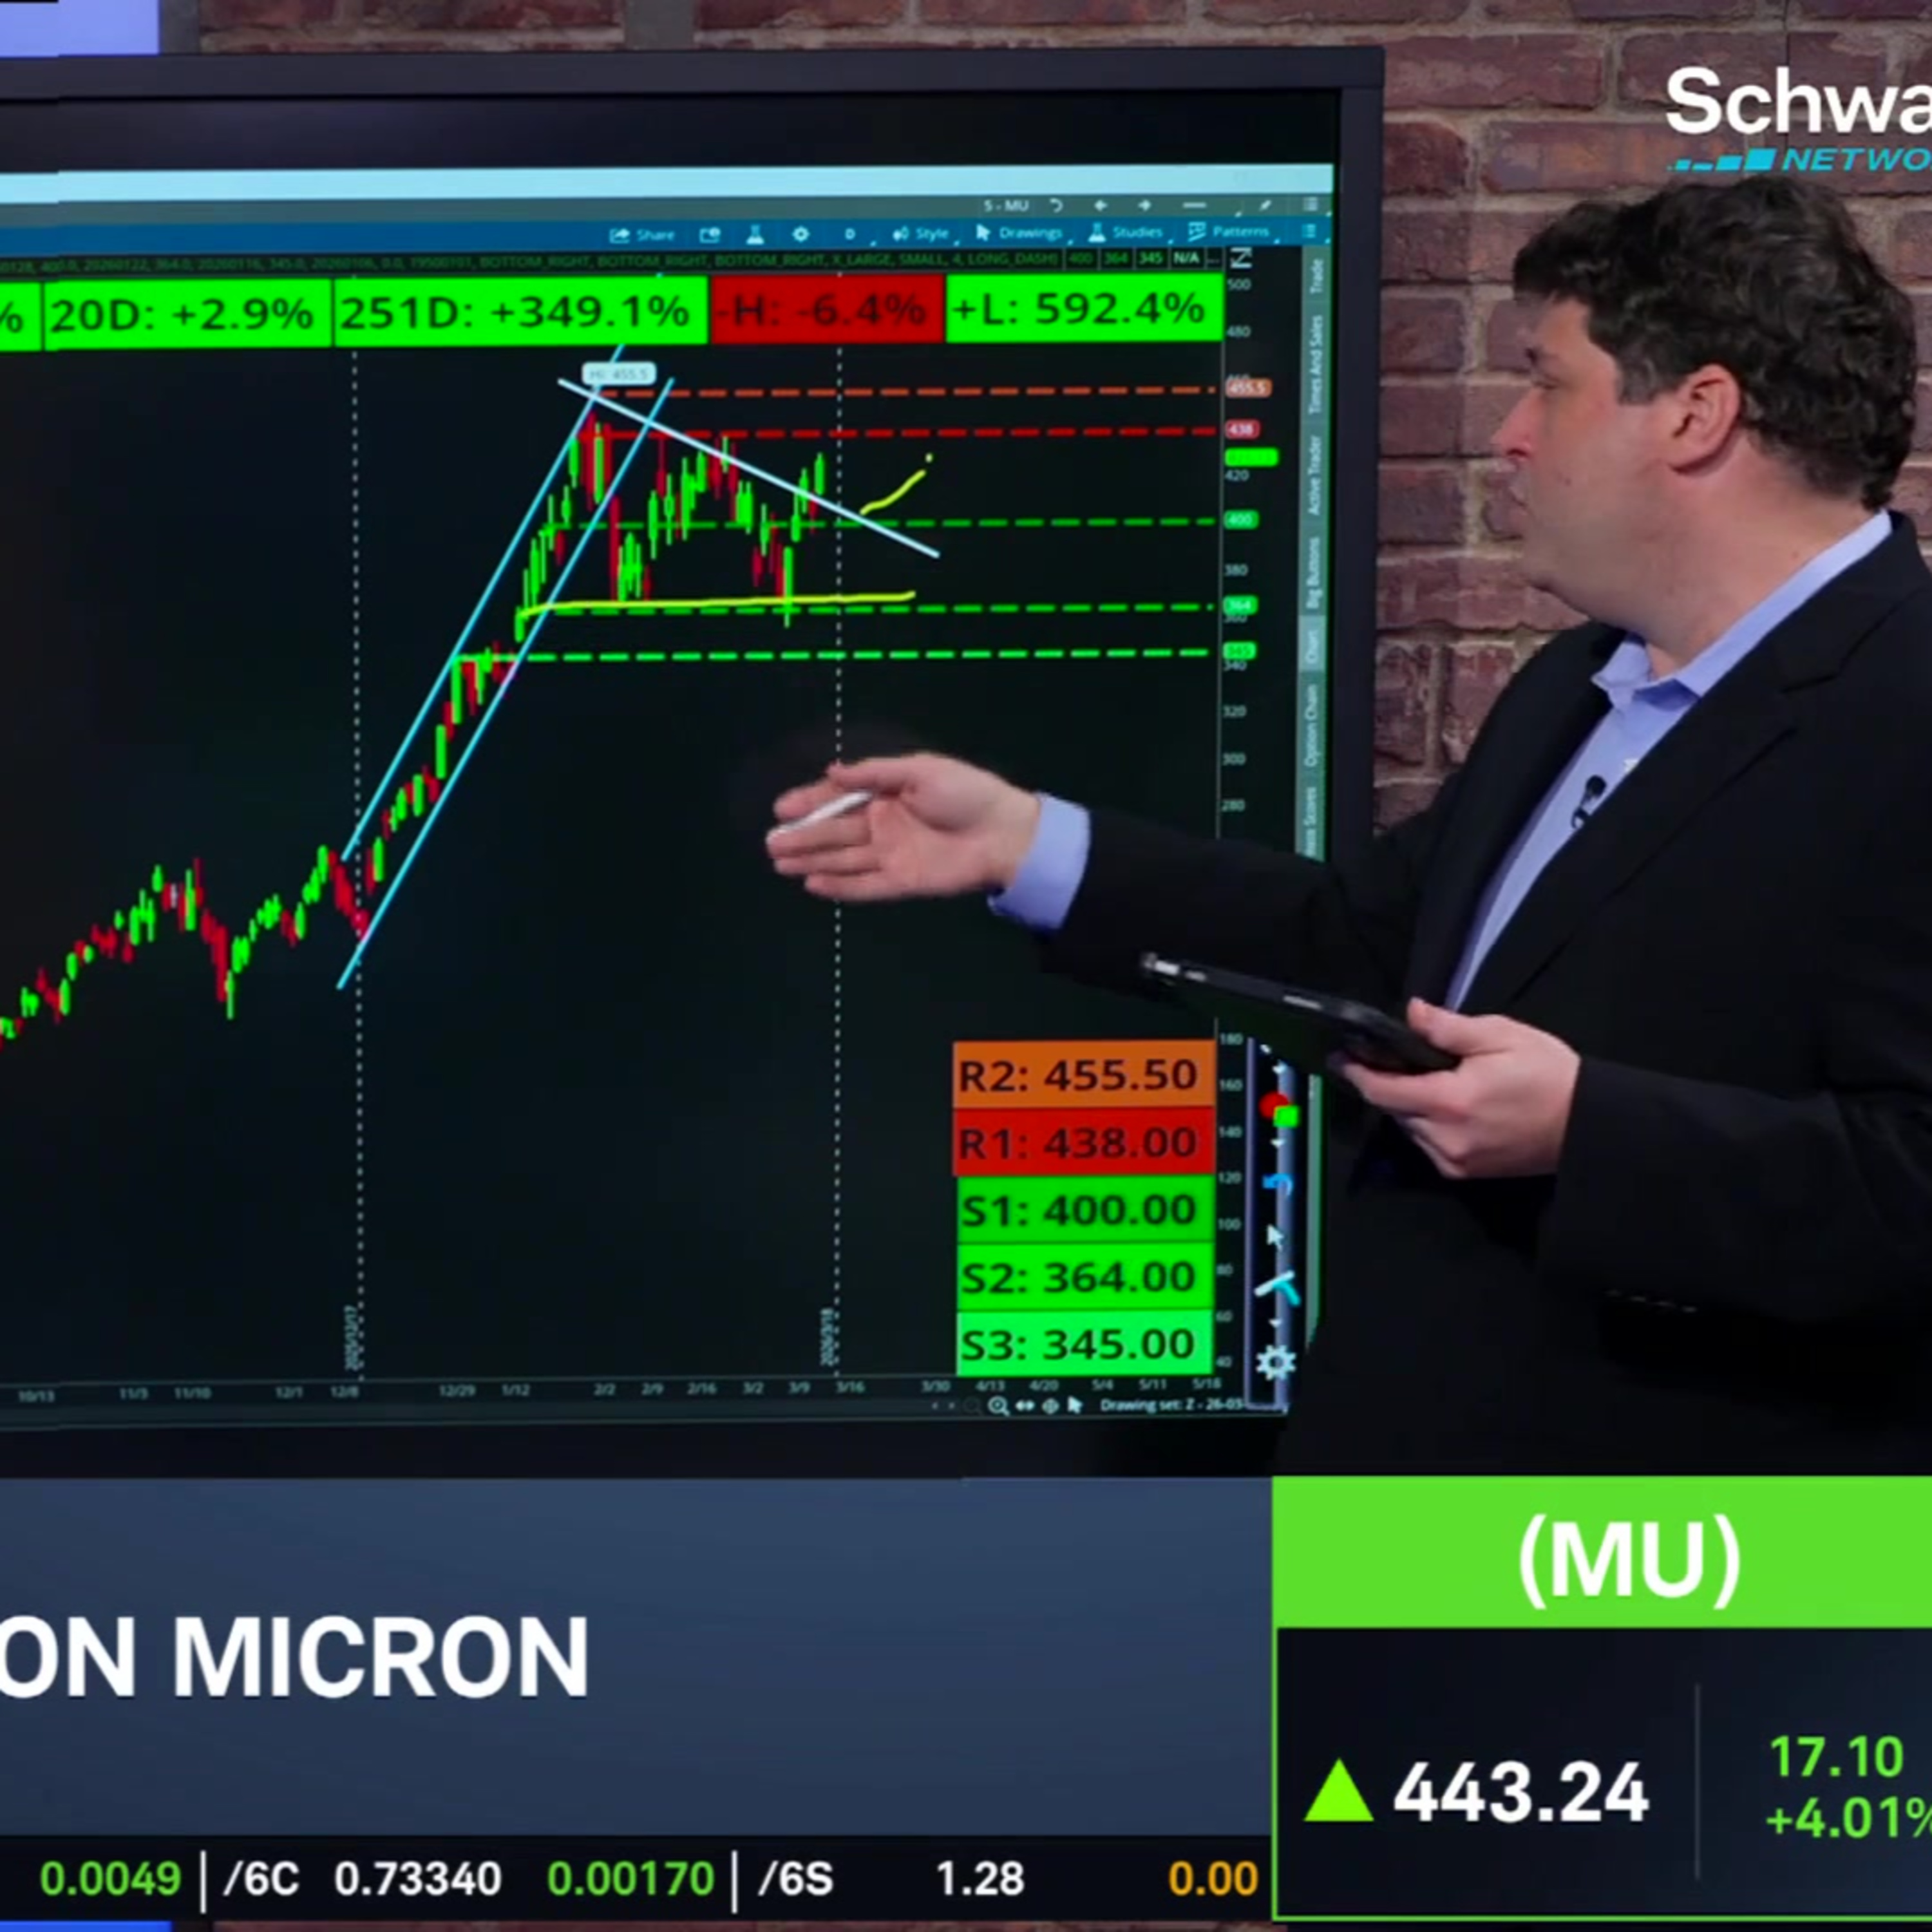
Micron's (MU) rally compared to other chipmaking peers has gripped traders over recent months. Rick Ducat shows the stock's recent consolidation near all-time highs and talks about the company's "vast outperformance" likelihood to continue. He then turns to the options front to show where traders are pricing moves ahead.
======== Schwab Network ========
Empowering every investor and trader, every market day.
Subscribe to the Market Minute newsletter - https://schwabnetwork.com/subscribe
Download the iOS app - https://apps.apple.com/us/app/schwab-network/id1460719185
Download the Amazon Fire Tv App - https://www.amazon.com/TD-Ameritrade-Network/dp/B07KRD76C7
Watch on Sling - https://watch.sling.com/1/asset/191928615bd8d47686f94682aefaa007/watch
Watch on Vizio - https://www.vizio.com/en/watchfreeplus-explore
Watch on DistroTV - https://www.distro.tv/live/schwab-network/
Follow us on X – / schwabnetwork
Follow us on Facebook – / schwabnetwork
Follow us on LinkedIn - / schwab-network
About Schwab Network - https://schwabnetwork.com/about
Get every episode summarized
Each time Schwab Network publishes, we email you a written briefing from the transcript — the topics, who appeared, and any specific claims, with the ad reads skipped.
Email me new episodesFree for 3 shows. No card needed.
Transcript ready
49 searchable segments. Every word is indexed and playable.
Full transcript
Schwab Network — Options Corner: MU "Vast Outperformance" Among AI Chipmakers. Machine-transcribed; use the interactive transcript above to jump the player to any line.
So I'm now for options corner joining us now. Take a deeper look at the chart is duke dating himself, Rick duke cat. All right, Rick, talk to us about the trends you notice in this chart for micron. Yes, as you said, Diane, memories kind of the king of this semiconductor sector right now. You can see micron's vast out performance versus not only the SMH semiconductor ETF here, which is up 69% during the past year, but even just the broader market, XLK, micron, meanwhile up a 313%. And it's not just micron, either. It's this storage sector. You can see these companies like Seagate Technology, Western Digital Sandisk. These are again, the vast out performers versus the other semiconductor companies here. You know, everything else has been left in the dust by this fierce rally here. So now when we look at micron more specifically, our steep upward channel has been broken. We now have a downward sloping trend line here in white. And we seem to have stabilized for now at this level near 364. You can
see this marks a repeated low point for price below that we had a gap at which the high point came in around 345 before we had our push to the upside. Meanwhile, resistance, the area here near 438 marks our best closing price. We also have 455 here, marking the intraday high. So an interesting breakout scenario here. We would be kind of between these two lines according to our mark price the last time I checked here. So I should be a noteworthy trading day for us to begin the week with here. Our moving averages. We have crossed above all of them here. Our shortest weekly five day EMA and dark blue here lines up with our trend line. So this could be a supportive area as well near about a 411 roughly. Meanwhile, RSI crossing above the 50 midline, breaking its downward sloping trend line and red here. So a more favorable situation for the bulls according to this indicator as well. Finally, our volume profile study shows that price is starting to push above this heavy volume
concentration here. This kind of range between about 375 to 425. So this would then be the supportive point to be on the lookout for from the volume perspective, Diane. Okay. So what's the approach you would take for an example trade? You point out that strong performances had this year, the outperformance within memory, and it's also got earnings in front of us. So what's your what's your take here? Exactly. Yes, earnings coming up as well too within a couple of days here. So looking at our expected move for the next few months here, we're going to look at the May 15th expiration here. Our green box 60 days out plus or minus about 25% during that time horizon here. So when we overlay our studies over each other here, we can see this notable area. It was an old area where our gap came in our volume profile node here. It's kind of below our trading range. And it's the edge of the expected move boundaries. So we'll be targeting this area with an example trade minus one May 15th, 35340 put vertical at a 250 credit here. So 250, 250 dollars our credit
received would be our max profit our max loss 750 would be our the most we could lose in this defined risk trade here. So about one to three reward to risk ratio, a common example traders would look for when structuring a trade, break even 34750 about 22% to the downside expected move about 25%. So more of a higher probability trade banking on that supportive area holding, certainly not a guarantee it will or anything like that. Just looking at the technicals here. That seems like a noteworthy area where the bulls could find a foothold here based on strong prior price activity that kept bouncing off that same area several times, Dan. All right. Thank you, Rick. Appreciate that.
More episodes
More from Schwab Network

JNJ Balances Growth, Patent Transitions, and Legal Overhangs
Schwab Network

nCino (NCNO) CEO on Earnings, AI in Banking & Overcoming "SaaS-pocalypse"
Schwab Network

The Big 3: NET, TWLO, ASTS
Schwab Network

Tie Lasater on Inflation Floors, Energy Risk, and Private Credit Stress
Schwab Network