About this episode
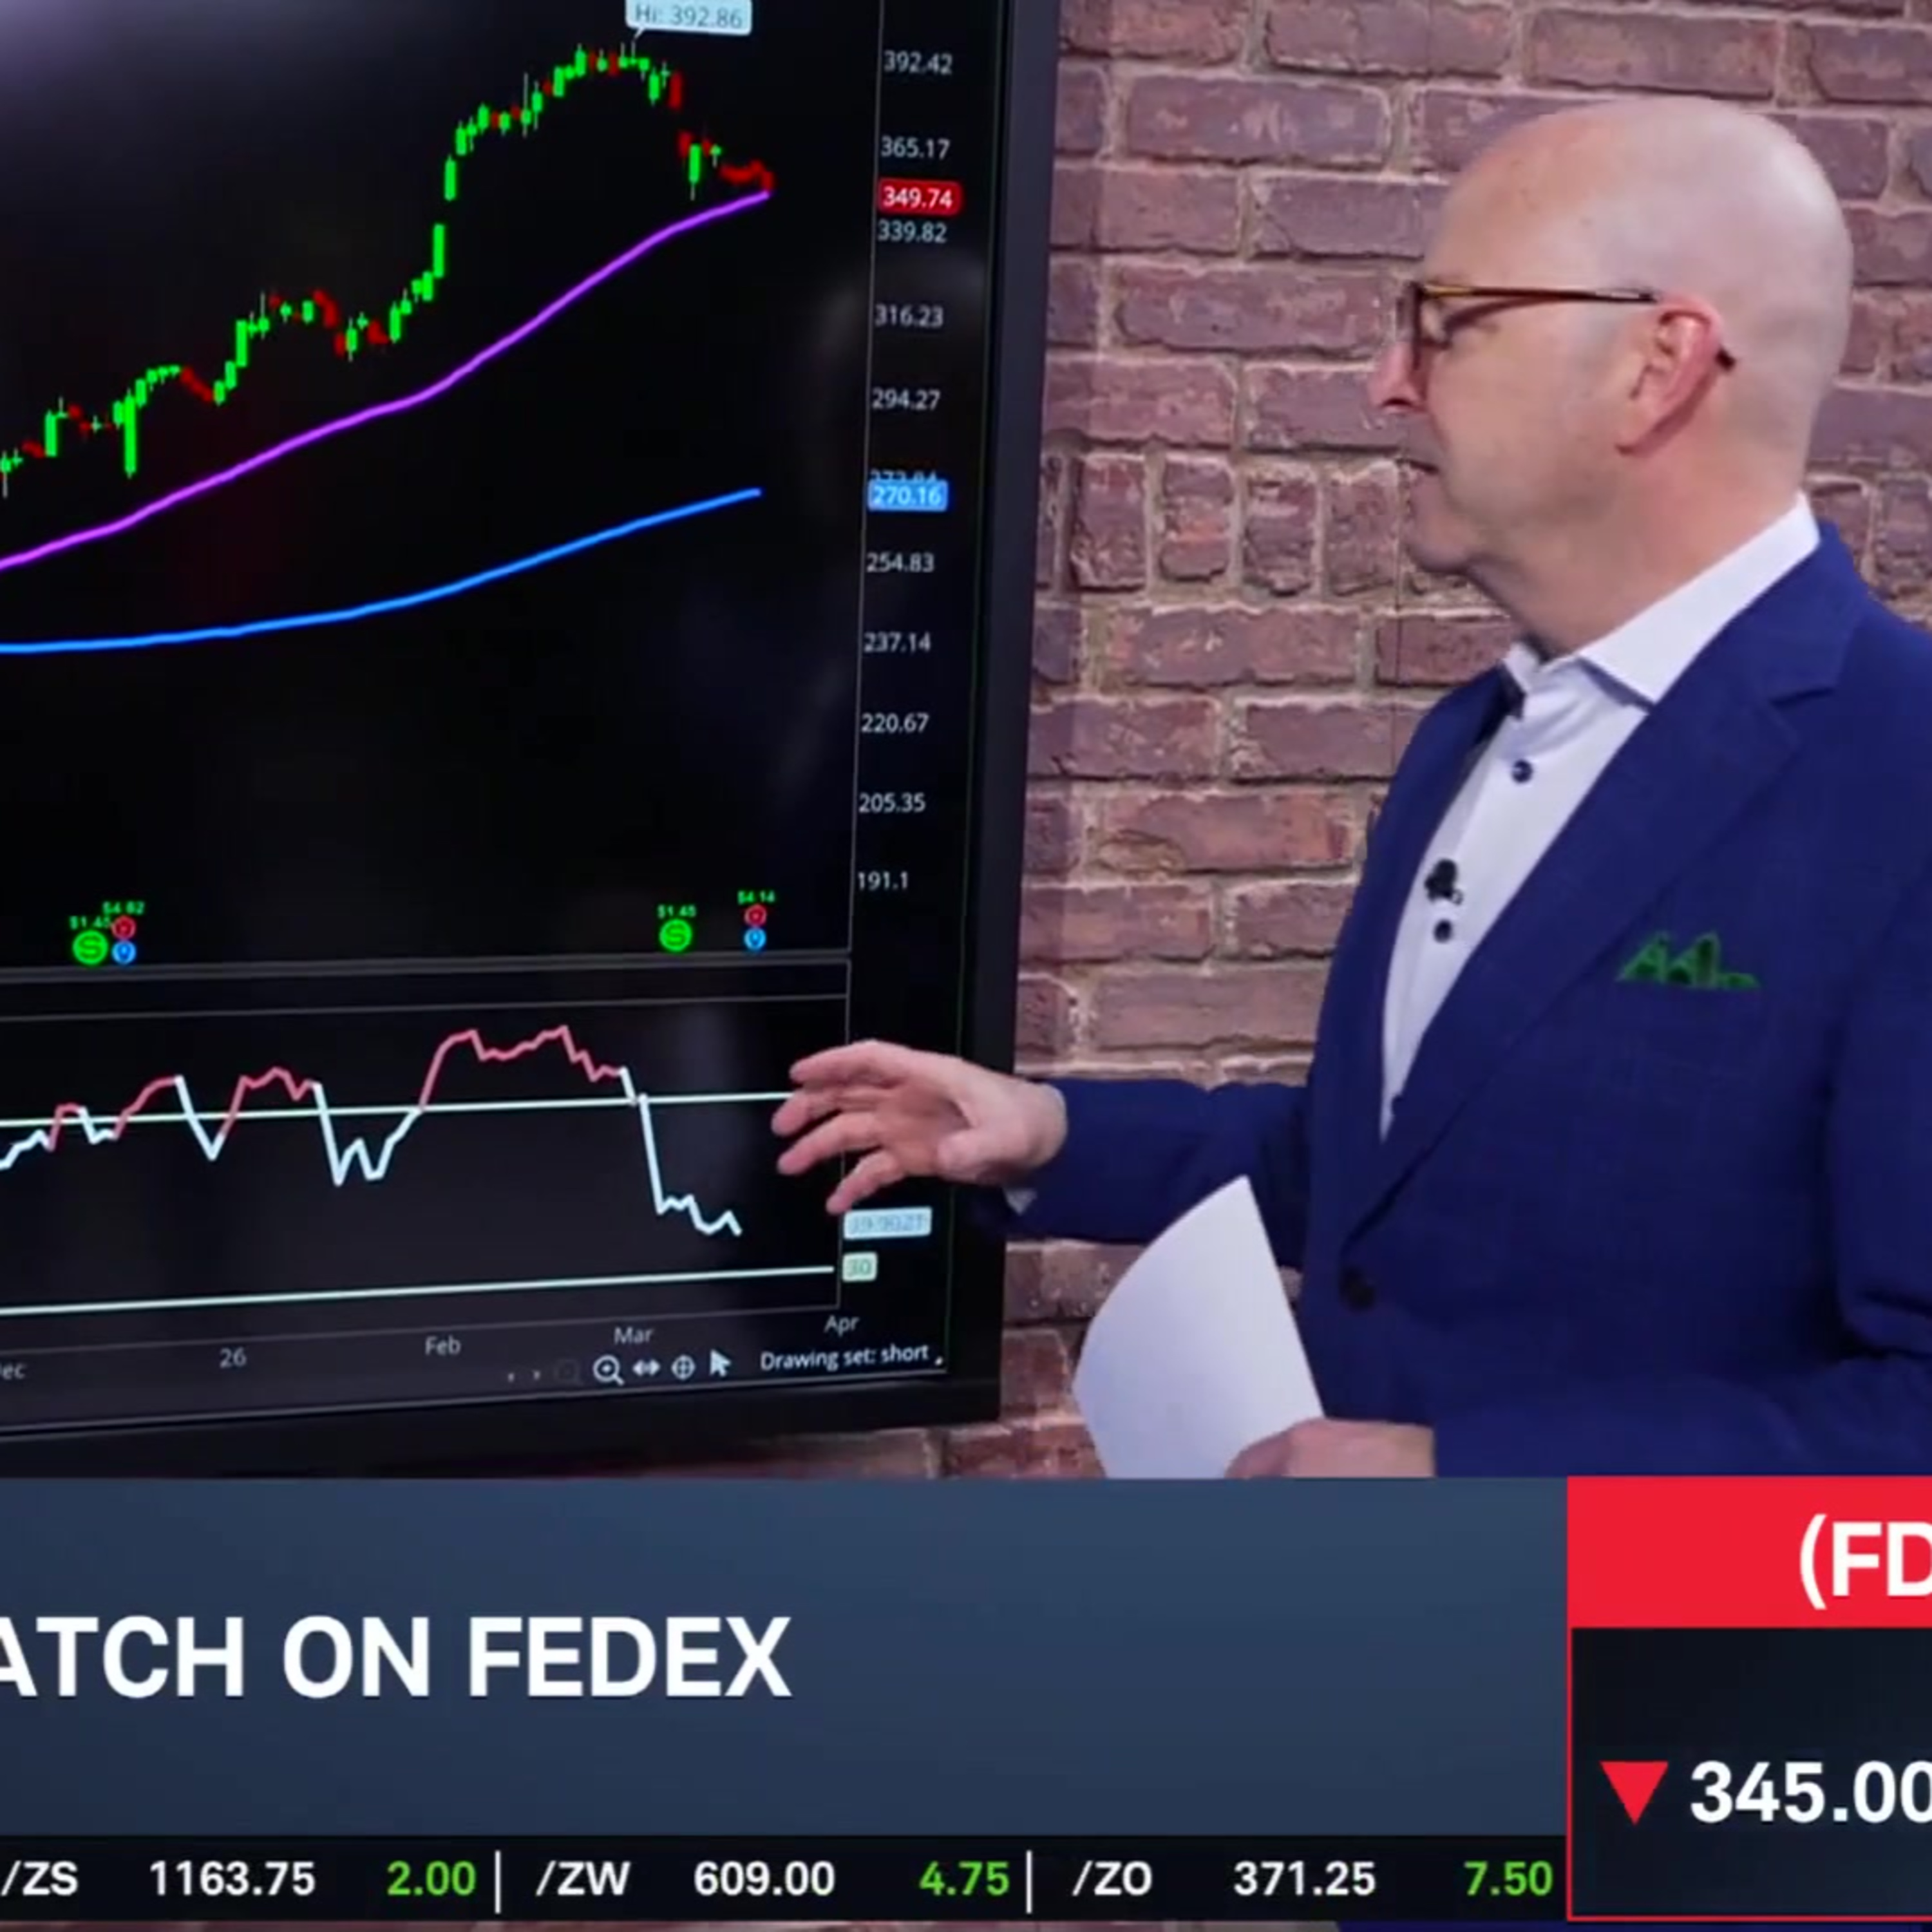
Tom White analyzes the latest price action in FedEx (FDX) with the company poised to report earnings after Thursday's close. He points out important support and resistance levels to watch while offering an example options trade for the stock.
======== Schwab Network ========
Empowering every investor and trader, every market day.
Subscribe to the Market Minute newsletter - https://schwabnetwork.com/subscribe
Download the iOS app - https://apps.apple.com/us/app/schwab-network/id1460719185
Download the Amazon Fire Tv App - https://www.amazon.com/TD-Ameritrade-Network/dp/B07KRD76C7
Watch on Sling - https://watch.sling.com/1/asset/191928615bd8d47686f94682aefaa007/watch
Watch on Vizio - https://www.vizio.com/en/watchfreeplus-explore
Watch on DistroTV - https://www.distro.tv/live/schwab-network/
Follow us on X – / schwabnetwork
Follow us on Facebook – / schwabnetwork
Follow us on LinkedIn - / schwab-network
About Schwab Network - https://schwabnetwork.com/about
Interactive timestamps
Jump to segmentGet every episode summarized
Each time Schwab Network publishes, we email you a written briefing from the transcript — the topics, who appeared, and any specific claims, with the ad reads skipped.
Email me new episodesFree for 3 shows. No card needed.
Transcript ready
55 searchable segments. Every word is indexed and playable.
Full transcript
Schwab Network — Options Corner: FDX Pulls Back into Earnings. Machine-transcribed; use the interactive transcript above to jump the player to any line.
0:00time now for options corner or joining us take a deeper look at the chart It's Tom White senior options contributor and co-host a fast market all right Tom Let's get into this chart. What trends do you notice? Well, first I wanted to look at something a little broader We went back about five years on a weekly chart I wanted to kind of take a look at that because you remember after the pandemic in about 20 21 20 22 Stock spiked pretty Substantially because a lot of people were getting things delivered But we're only up about 23% from those levels that we saw way back here about five years ago So it's been a choppy chart until you get towards the tail end of this five-year chart And that's where we see the parabolic move to the upside you mentioned that we saw all time highs so While the near term it's been pretty significant gains in parabolic move to the upside on a longer term basis Still regular relatively muted growth from comparable to maybe the S&P 500 or some of the other major indices over the last five years or so
1:03So let's tighten it up and look at a one-year chart here in FedEx It'll give you a good idea of the optimism on the stock and a lot of that has to do with the cost initiatives They're drive program where they've been slashing costs now. That's going to help margins That's going to help profitability, but at the same time the core segment of their business the delivery side has been pretty stagnant here But here's a one-year one-day chart here in FedEx stock is up pretty significantly from year ago levels It has pulled that back you mentioned the all-time highs of 392 bucks that we hit at the end of February Right before the conflict started in the Middle East now We've pulled back about 11 12% from those levels over the last three weeks or so. So that's a concern We've seen overbought conditions Throughout the month of February, but now we're starting to see the RSI on here Dripped down near the 40 level stocks under pressure here a little bit today also with this with the market down
2:08But a couple of key Simple moving averages. I kind of wanted to take a look at 200-day moving average all the way down to 270 So that parabolic move 200-day hasn't caught up But in a look where we are right now in the 50-day simple moving average We're right at that level at about three nine three hundred and forty nine dollars It's been a key area of support since last October do we hold that going in earnings? I think that's going to be one of the key things that we're going to have to take a look at Okay, then what's the approach you would take for an example trade, Tom? Well, I looked at something bullish here that takes advantage of that pullback that we've seen We've seen a lot of price targets above the four hundred four hundred and fifty dollar level in here So I looked at a bullish call diagonal that takes advantage of volatility dispersion between the different options series So we wanted to went out to the April 17th monthly options or 29 days to expiration We're going to buy the three forty strike call that's going to be in the money by about eight nine dollars And that's got that higher delta reacts more like the stock and then against that in the near term March 20th monthly
3:11Options that expire in just one day. We're going to sell the three sixty five strike call So a bullish twenty five dollar wide call diagonal I'm going to pay roughly about a sixteen and a half debit So it's twenty five dollars wide, but I'm paying a lot less than the width of that call diagonal Now if I pay a sixteen fifty debit, there's my wrist sixteen hundred and fifty dollars per spread But you can see here from the risk profile anything above about the three forty five levels going to be profitability on this trade Eight packs of profitability right at or near that three sixty five line That's where you want this stock to go and that's about the one standard deviation move that the option market Pricing in which is just about a plus or minus six percent move just over twenty one dollars either way so That option that I sold on the three sixty five aligns with about that one standard deviation because we're paying less than Then the width of this call diagonal anything above three forty five is going to be profitability But even if it does go above three sixty five goes back towards those all-time highs is going to be profitability
4:14You're buying a really low implied volatility in the April options on that three forty call Then what you're selling in the near term options due to that event risk with earnings But this is a bullish example here if you think the stock is going to go higher All right, thank you Tom appreciate that that's an example trade there for FedEx Which has earnings due after the close to Jay
More episodes
More from Schwab Network

JNJ Balances Growth, Patent Transitions, and Legal Overhangs
Schwab Network

nCino (NCNO) CEO on Earnings, AI in Banking & Overcoming "SaaS-pocalypse"
Schwab Network

The Big 3: NET, TWLO, ASTS
Schwab Network

Tie Lasater on Inflation Floors, Energy Risk, and Private Credit Stress
Schwab Network