About this episode
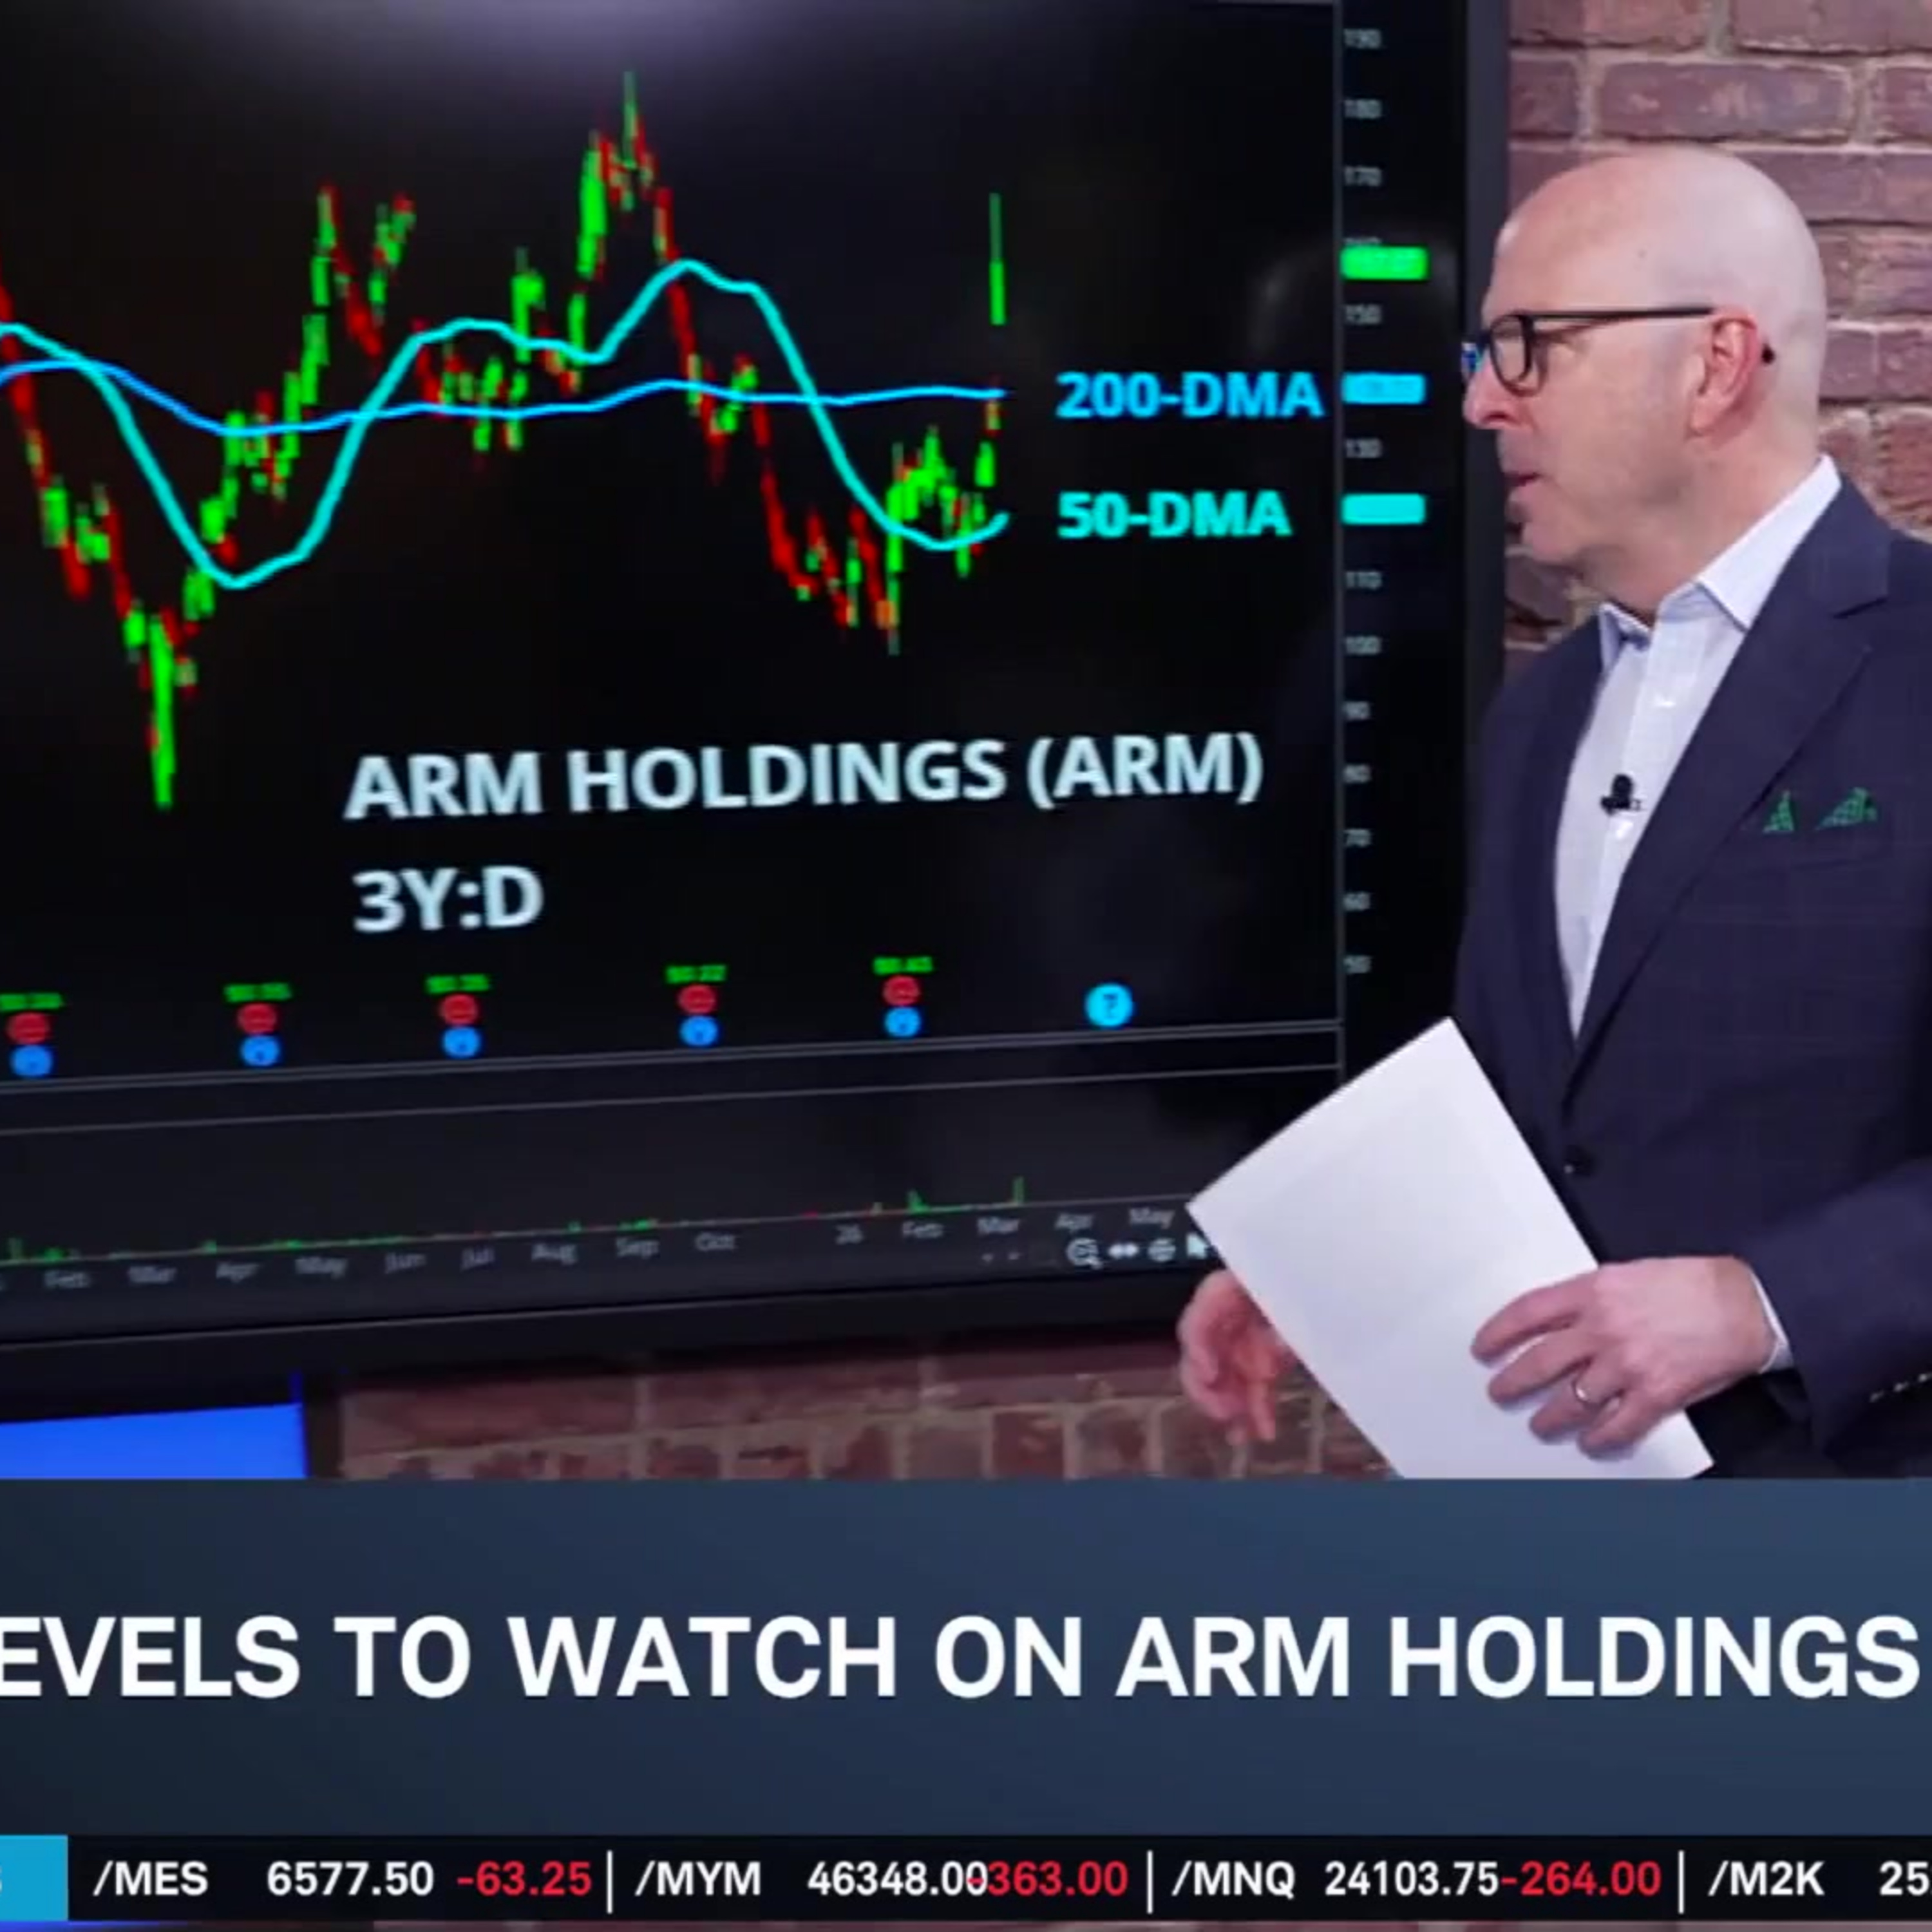
Arm Holdings (ARM) surged on Wednesday on strong revenue guidance through 2031. Tom White points out that shares still have room to break out when turning to the 3-year chart, though the stock faces technical pressure with an overbought RSI. He explains how technicals back key support and resistance levels while offering an example options trade for Arm.
======== Schwab Network ========
Empowering every investor and trader, every market day.
Options involve risks and are not suitable for all investors. Before trading, read the Options Disclosure Document. http://bit.ly/2v9tH6D
Subscribe to the Market Minute newsletter - https://schwabnetwork.com/subscribe
Download the iOS app - https://apps.apple.com/us/app/schwab-network/id1460719185
Download the Amazon Fire Tv App - https://www.amazon.com/TD-Ameritrade-Network/dp/B07KRD76C7
Watch on Sling - https://watch.sling.com/1/asset/191928615bd8d47686f94682aefaa007/watch
Watch on Vizio - https://www.vizio.com/en/watchfreeplus-explore
Watch on DistroTV - https://www.distro.tv/live/schwab-network/
Follow us on X – https://twitter.com/schwabnetwork
Follow us on Facebook – https://www.facebook.com/schwabnetwork
Follow us on LinkedIn - https://www.linkedin.com/company/schwab-network/
About Schwab Network - https://schwabnetwork.com/about
Interactive timestamps
Jump to segmentGet every episode summarized
Each time Schwab Network publishes, we email you a written briefing from the transcript — the topics, who appeared, and any specific claims, with the ad reads skipped.
Email me new episodesFree for 3 shows. No card needed.
Hosts & guests
Transcript ready
108 searchable segments. Every word is indexed and playable.
Full transcript
Schwab Network — Options Corner: ARM's Path to Record Highs & Example Trade. Machine-transcribed; use the interactive transcript above to jump the player to any line.
0:00We're back home morning, mover shares of arm holding still on track for weekly gains. This morning, Needham upgrading shares to a buy with a $200 price target. The firm said arms, quote, high stake, abets, including raising royalty rates, going into subsystems and making its own silicon, are paying off. Needham said arm has become a credible AI play right around the time when the company has better structured itself to capture greater value from AI. Some now for options for an urge to take a deeper look at the trends on the chart. This is Tom Whiteco, host of fast market and senior options contributor. All right, Tom. Talk us through the trends you noticed on this chart. Yeah, Diane. I want to kind of give you a broader look at arm holdings because we've had nice gains this week, about 18% to the upside on the news that they're going to start developing CPUs and the upgrades that we're seeing in this stock. But if you look at this over a three year one day chart, that's pretty choppy. So we've had fits and starts in this stock over the last, basically about two and a half years or so.
1:00And then you're seeing this big pop here. Got a couple moving averages here on our chart, 50 day simple moving average down at 120. Acted a lot by a little bit of area of support around 120. And then we have the 200 day moving average, which is, you can tell, it's been flat lining because of the chop we've seen in the shares. Now we're firmly above that stock closed about 157 yesterday. So this is kind of reflective that yeah, we're seeing a nice move here in arm holdings this week, you know, with those 18% gains. But remember, even during good news, during earnings events, it's been a choppy three year cycle for this one. Now I've got another chart, it's a little bit shorter term and it'll kind of give you a better gauge of what we've seen over the near term in these shares. One day or one year one day chart here in arm holdings. And you know, that chop still continues here. Now it's not immune to moves in the overall market. You've got to take that into consideration on some of these.
2:01But some levels to kind of keep an eye on this one 38 level. That's basically about that 200 day moving average. So that was a big area of resistance that we saw before this breakout that we saw just earlier this week. So now that's been broken to the upside. What areas do you have to look beyond that to kind of create some headwinds? Now the stock hit 166 yesterday, but we've got levels around the 162, 163 level that are probably going to be a little bit area of resistance. And finally, on this chart, we'll look at momentum indicators, not surprisingly. We're seeing that relative strength index, the RSI, near the 77 level on this pop that we're seeing so far this week. So in overbought territory as far as a technical basis, but that doesn't mean the stock is going to stop going up, but it did pull back from those highs that we saw yesterday after the news. Okay. What's the approach you would take for an example trade, especially with that strong move
3:02attack recently? Well, this fits into that narrative of chop that I talked about over the last three years over the last 12 months in the shares. You might be comfortable that, hey, this is a new news item that they're going to start developing their own CPUs, they expect $15 billion over the next five years. Does that come to fruition or does this chop continue? So I looked at a strategy that takes advantage of a bullish scenario, but at the same time giving myself plenty of room to the downside in case we don't get that move and we see more chop in the stock. So I looked at a cash-secured put here. Now I went out to the April monthly options, April 17th. So 22 days to expiration, I've got three weeks in this position where I'm going to take advantage of the fact that, hey, we're starting to see some implied volatility levels that are elevated in the overall market, even though it's come down a little bit in arm. But selling the $145 strike put, that's out of the money to the downside. As I mentioned, the stock looks like it's going to open up about $157.
4:05So we sell that out of the money $145 put for a neutral to bullish cash-secured put. We're going to collect a credit if we open up right here about $4.5. That's my potential profitability on this. But a cash-secured put is a two-fold type of position where, hey, I just want to sell that out of the money put. The stock remains above my $145 put. I get to keep that $450 credit I collected per put that I sold. Or if the stock does chop and pulls back, I'm willing to buy the shares. So you've got to have that thought or that narrative that I'm willing to own the shares that the stock does fall below that $145 put. If I collect that $450 credit, it takes my break even down to $140.50 to the downside. That's about a 10% move to the downside before I start getting hurt on this type of position. So there's that cushion that I got. Now it's capital intensive because you have that potential that you might have to buy the shares if you're still short to put. And the stock goes below that $145 strike into expiration on this one.
5:10So it's a two-fold type of trade. I mentioned it's capital intensive. My break even goes down to $140.50. Well, what's my risk? Well, I got a lot of risk on it because it is capital intensive, right? About $14,000 in risk. But that is if the stock goes to zero. So you've got to keep that in mind in into context. But on a buying power type of scenario, you've got to keep that in mind that you might have to buy the shares. Now this is one of those strategies I tend to look at when I see chop in a chart like that. Or I look at it this way where, hey, I might put a bid in for $140.50 on this stock, right? Maybe $100 shares, maybe $1000 shares depending on how much you want to buy. You might not ever get filled on that. You might not ever be able to pay $140.50 for these shares. But this type of strategy allows you to participate in upside movement, consolidation, or even a slight pullback. Or if you do want to own the shares, it falls below $145, you get to buy them at that
6:13break even level of $140.50. So there's the trade-off where, hey, I can put $140 bid in on this stock. I might not ever get filled. This strategy allows you to still profit if it remains above that $145 level. All right. Thank you, Tom. I appreciate that. Tom, later today on, fast market.
More episodes
More from Schwab Network

JNJ Balances Growth, Patent Transitions, and Legal Overhangs
Schwab Network

nCino (NCNO) CEO on Earnings, AI in Banking & Overcoming "SaaS-pocalypse"
Schwab Network

The Big 3: NET, TWLO, ASTS
Schwab Network

Tie Lasater on Inflation Floors, Energy Risk, and Private Credit Stress
Schwab Network