About this episode
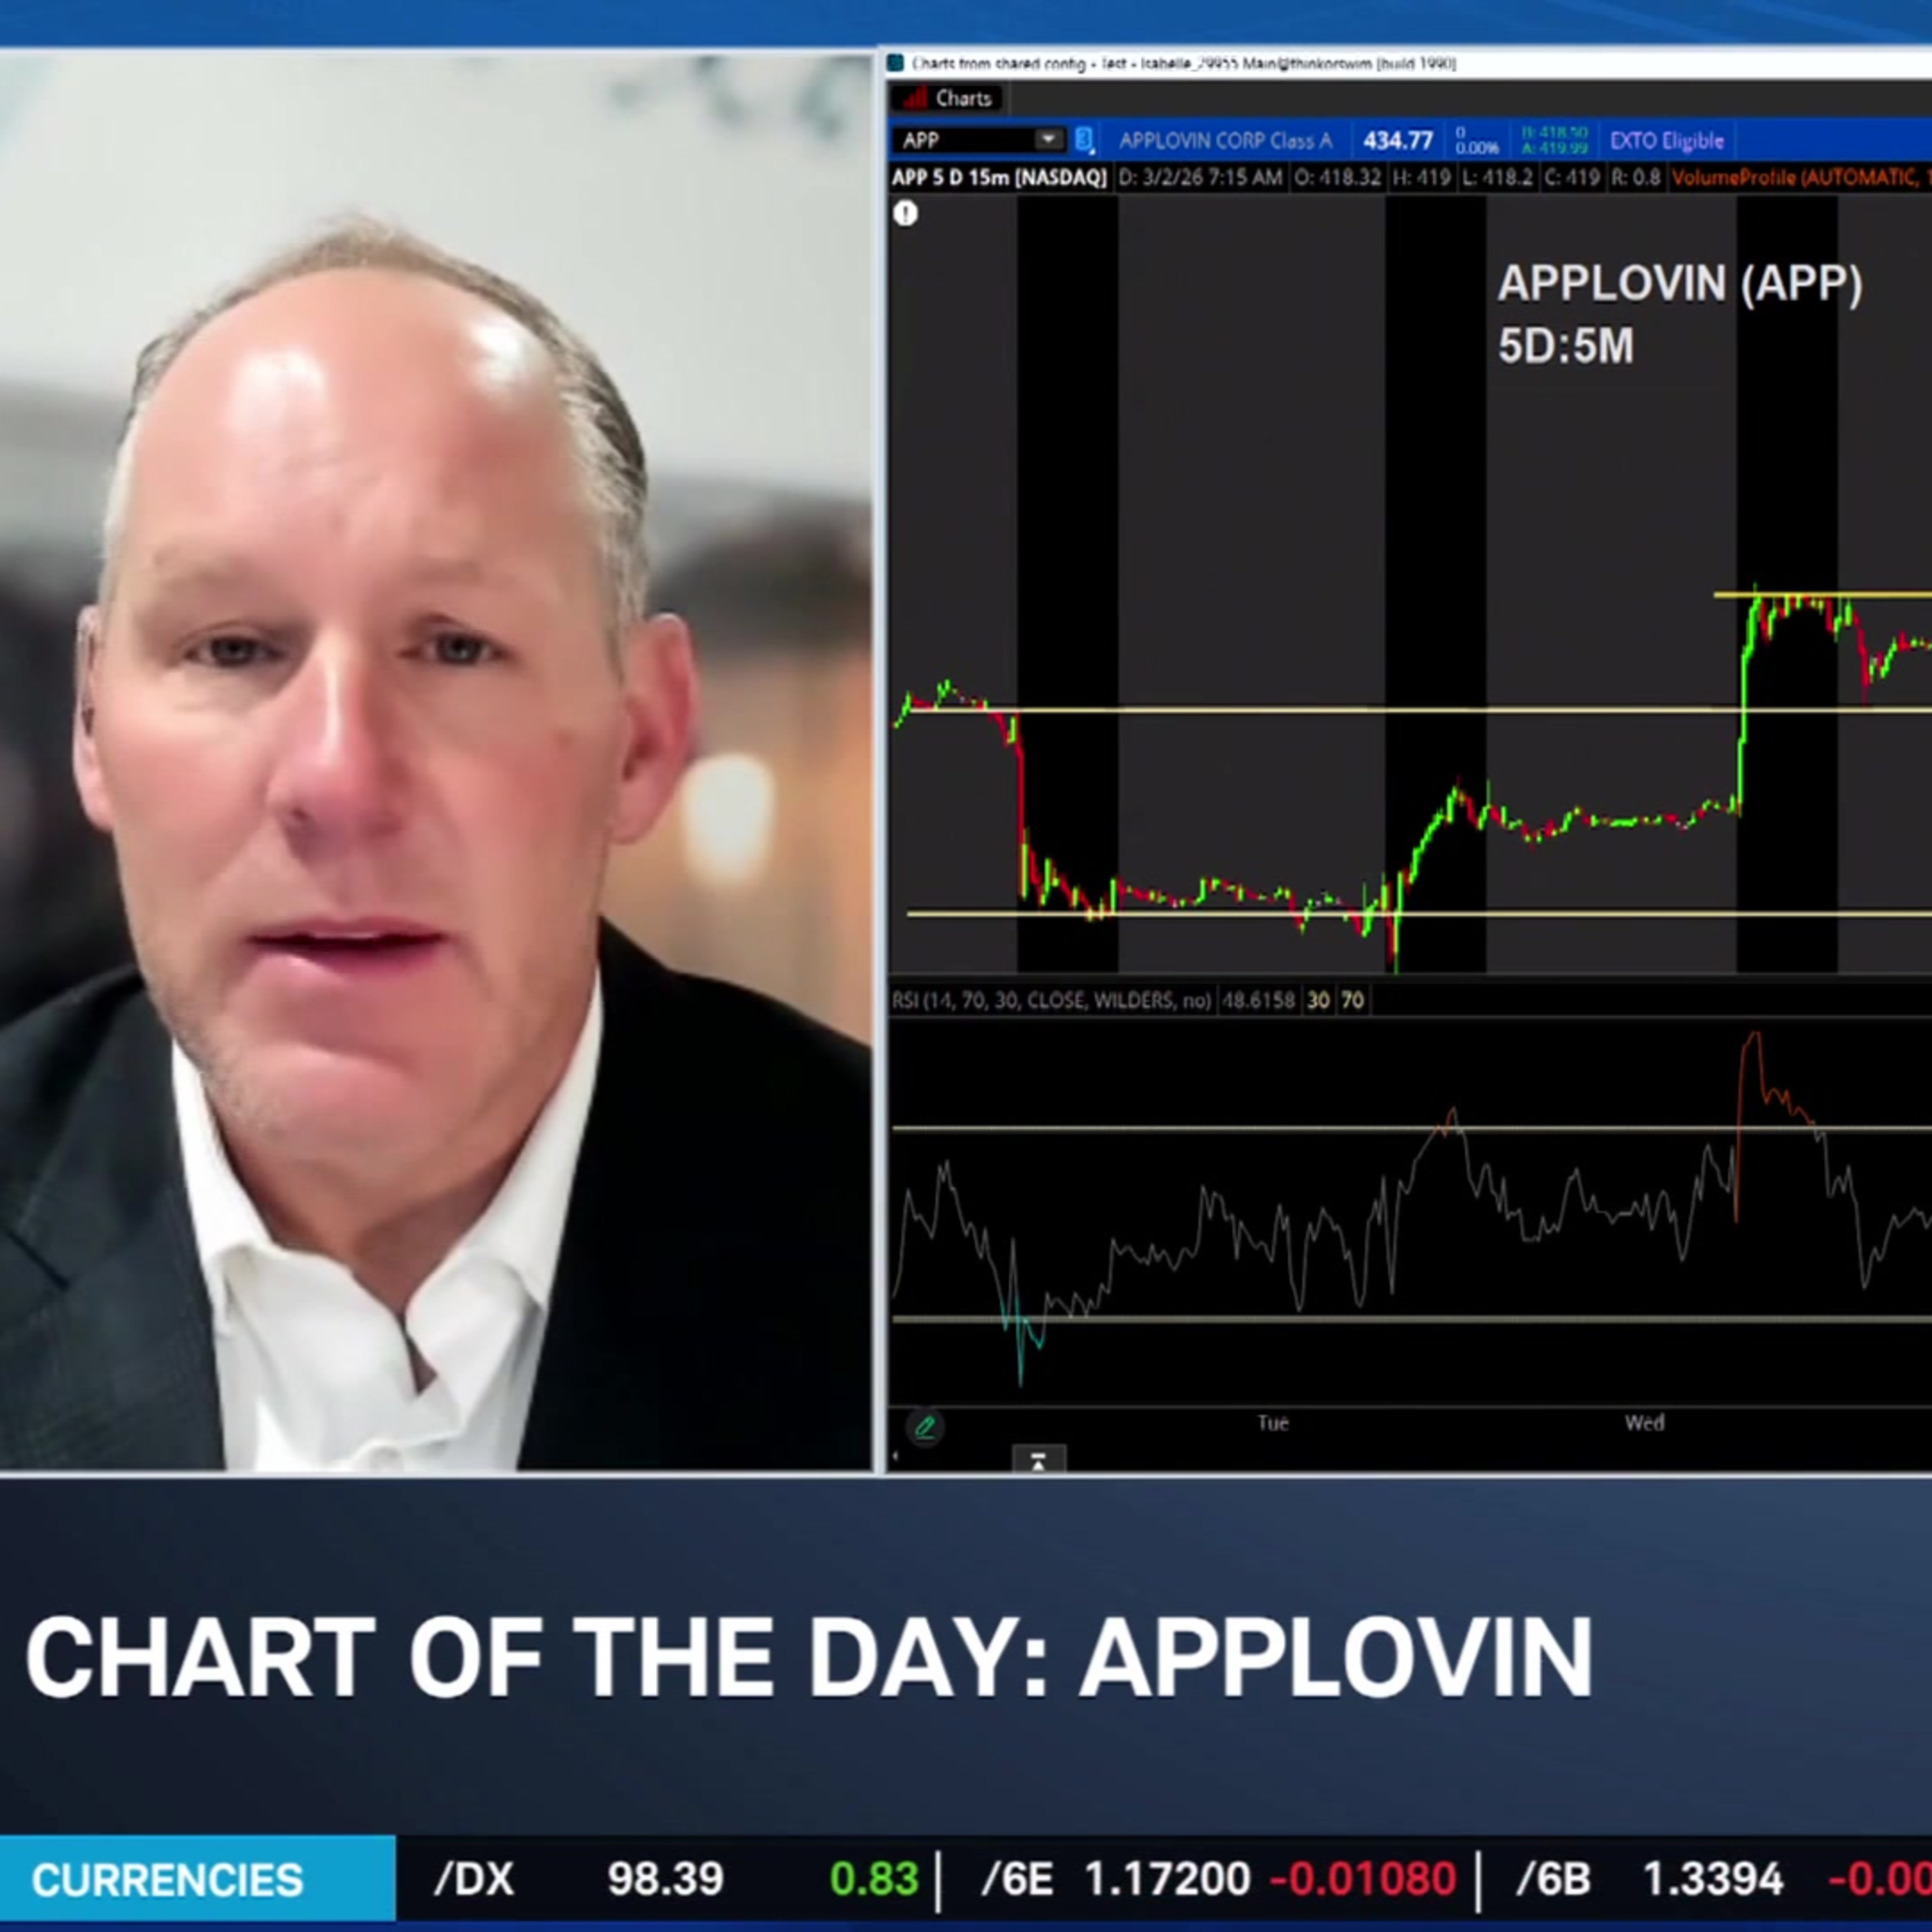
Applovin (APP) experienced wide swings in its stock price, highlighted by Charles Schwab's Brett Crowther as he breaks down the five-day chart. He then turns to the one-year chart and explains where investors can expect support and resistance.
======== Schwab Network ========
Empowering every investor and trader, every market day.
Subscribe to the Market Minute newsletter - https://schwabnetwork.com/subscribe
Download the iOS app - https://apps.apple.com/us/app/schwab-network/id1460719185
Download the Amazon Fire Tv App - https://www.amazon.com/TD-Ameritrade-Network/dp/B07KRD76C7
Watch on Sling - https://watch.sling.com/1/asset/191928615bd8d47686f94682aefaa007/watch
Watch on Vizio - https://www.vizio.com/en/watchfreeplus-explore
Watch on DistroTV - https://www.distro.tv/live/schwab-network/
Follow us on X – / schwabnetwork
Follow us on Facebook – / schwabnetwork
Follow us on LinkedIn - / schwab-network
About Schwab Network - https://schwabnetwork.com/about
Get every episode summarized
Each time Schwab Network publishes, we email you a written briefing from the transcript — the topics, who appeared, and any specific claims, with the ad reads skipped.
Email me new episodesFree for 3 shows. No card needed.
Transcript ready
80 searchable segments. Every word is indexed and playable.
Full transcript
Schwab Network — Chart of the Day: APP Technical Levels. Machine-transcribed; use the interactive transcript above to jump the player to any line.
So I'm now for our chart of the day joining us for a breakdown as Brett Crowder senior managers for eating and derivatives coaching Charles Schwab. Brett, good to see you this morning and looks like App Love is going to get caught up with the broader market downturn that we're seeing and expecting for today's session. But you've got a short term look at this beyond today. What does that look like? Yes, good morning to you as well, Diane. Looking at App Love and it's been an interesting, actually last week pulling into this week. And so if we go to the five day, five minute chart, I've drawn in several support levels that this is bounce off of. And I want to point out with these four ranges, the bottom one is 376, and the top one is 446. That's a $70 range on a five day, five minute chart. This stock can move. Now what we've seen recently last Thursday to Friday, it broke above that 425. I've hit the 446, came down, bounced again out the 425, rallied up the 446 again, creating a double top, which over this weekend, it broke below that kind of leaving into what
you've been talking about all the activity that's been going on across the board in the market. And so App Love and it was no different. It did drop down. It found support at 407 before rallying back up that 425. Now I do have a downward trend line in there that has been holding the stock down. And so it has felt there yet break above that. Now looking at the RSI a little bit below, we'll see is it actually did break above a similar downward trend line. And so what that's indicating is there is some bullish pressure. There is some momentum here trying to push the stock higher in early morning trading. But as of yet, the stock has not followed suit. And so this is going to be interesting as we kind of work into this opening bell. Will the stock finally break above that resistance, rallying above 425, even up to 426 or the pressure is there, but as of yet, it has not been able to finally muster the actual chart print. Yeah. And it's been a difficult year so far for App Love and with some accusations swirling
around it, which has been trying to back back. If you look at it all over a one year period, it looks better. Let's zoom out and talk us through what you noticed in the chart. Longer term. Yeah. Yeah, for sure, Dan. On the longer term chart, I drew a trend line that has been in place for quite a while going back to March last year, you can see a diagonal trend line that the stock was bouncing off of having a pretty good upward trend moving along quite nicely. But in late January, it probably broke that trend line, which gave the first indication of some weakness on this stock. And then it fell down to 518, which was a support level. So it had a double top in here as well, hitting a high in August, bouncing off that 518 and rallying again, hitting it again in December, which it broke through at the end of January. Right at that 518 on a very big candle. And then up into the door for a little bit more of a free fall. Now with that double top, typically the idea behind that is a stock would run that with again between those blue lines, which actually put it close to 320, but it didn't quite make
it all the way down there. At least it has not as of yet. It found some support a little bit higher than that around 360. And it is kind of channeling, bouncing around in that area between 360 and 450 now. It closed last week, closer to 450. It is about 420 this morning. So it was a little bit below that, but kind of what we were talking about in a short term timeframe. This one as well on the RSI has broken above that downward trend line indicating there are some bullish pressure building. However, again, the stock has yet to really follow through and make a good run. But here's a deal. It's holding 360. It could possibly, you know, rally up to 518 if it breaks through that, again, opens the door for something higher like the 731. But this is an interesting stock to watch it in. And really, the crazy thing about this stock is the range on this stock is $36 the average range. I mean, this thing can run from 20, 30, 40, $50 a day and just being in its normal movement. So it is a mover. And when we have activity like what we've seen this weekend, it could even add to that.
So it's something to keep an eye on. But again, 360 up to 518 would be the ranges to watch for now, Dan. OK, all right, that's the range to watch. We shall see, but again, the pressure expected to be on today. Thank you, Brett. That's Brett Crowder, a senior manager for eating and derivatives coaching Charles Schwab.
More episodes
More from Schwab Network

JNJ Balances Growth, Patent Transitions, and Legal Overhangs
Schwab Network

nCino (NCNO) CEO on Earnings, AI in Banking & Overcoming "SaaS-pocalypse"
Schwab Network

The Big 3: NET, TWLO, ASTS
Schwab Network

Tie Lasater on Inflation Floors, Energy Risk, and Private Credit Stress
Schwab Network